Tools for developing, programming and debugging
A tool-chain is a set of programs which are used to develope, compile, debug and monitor an application. Setting up a complete toolchain can help to speed up the development, as they are configured to work together, mainly in automated scripts or having shared data format.
Last update: 2022-06-07
Table of Content
There are many developement environemts to work with STM32 MCUs, such as the official STM32 IDE, ARM Keil, PlatformIO, Mbed, Arduino, etc.
STM32 Ecosystem#
A tool-chain is a set of programming tools that allow developers to:
- Configure the settings on the target MCU
- Write code and navigate inside source files of the project
- Inspect the code to show additional information about variables, function definitions, etc.
- Compile the source code to an executable application
- Program the target MCU
- Debug the application running on the target MCU
- Monitor the application on the target MCU
The STM32Cube ecosystem is a complete software solution for STM32 microcontrollers and microprocessors. It has a complete tool chain and extended packages to well support developers on STM32 MCUs.
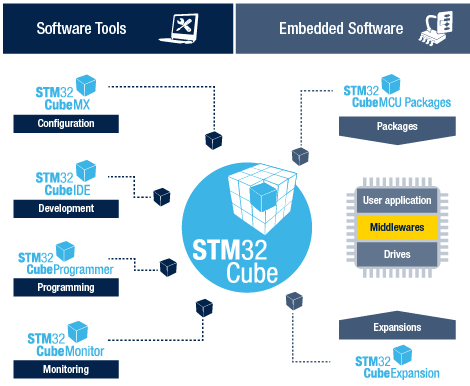
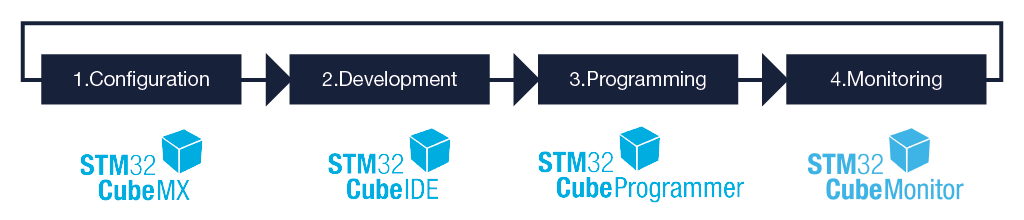
STM32CubeMX, a configuration tool for any STM32 device. This easy-to-use graphical user interface generates initialization C code for Cortex-M cores and generates the Linux device tree source for Cortex-A cores.
STM32CubeIDE, an Integrated Development Environment. Based on open-source solutions like Eclipse or the GNU C/C++ tool chain, this IDE includes compilation reporting features and advanced debug features. It also integrates additional features present in other tools from the ecosystem, such as the HW and SW initialization and code generation from STM32CubeMX. This software includes:
-
Eclipse IDE — an open source code editor and manager which supports many plugins such as C/C++ Development Platform, GCC Cross-Compiler, GDB Hardware Debugger, Make and build scripts.
-
GNU ARM Cross-compiler with ST patch for STM32 MCUs — a compiler that converts code to executable and linkable file (.elf) or binary file (.bin, .hex).
-
GDB for inspecting, debugging the target application.
STM32CubeProgrammer, a programming tool. It provides an easy-to-use and efficient environment for reading, writing and verifying devices and external memories via a wide variety of available communication media (JTAG, SWD, UART, USB DFU, I2C, SPI, CAN, etc.).
STM32CubeMonitor, a monitoring tool. Powerful monitoring tools that help developers fine-tune the behavior and performance of their applications in real time.
STM32Cube MCU and MPU packages, dedicated to each STM32 series. Packages offer all the required to be embedded software bricks to operate the available set of STM32 peripherals. They include drivers (HAL, low-layer, etc.), middleware, and lots of example code used in a wide variety of real-world use cases.
STM32Cube expansion packages, for application-oriented solutions. Complementing and expanding the STM32Cube MCU Package offer with additional embedded software bricks, STM32 expansion packages come either from ST or approved partners to create an extensive and scalable embedded software offer around the STM32.
STM32CubeIDE#
STM32CubeIDE is an advanced C/C++ development platform with peripheral configuration, code generation, code compilation, and debug features for STM32 microcontrollers and microprocessors. It is based on the Eclipse®/CDT framework and GCC tool chain for the development, and GDB for the debugging. It allows the integration of the hundreds of existing plugins that complete the features of the Eclipse® IDE.
This tool includes the STM32CubeMX for code generation. At any time during the development, the user can return to the initialization and configuration of the peripherals or middleware and regenerate the initialization code with no impact on the user code written in the user blocks.
STM32CubeIDE includes build and stack analyzers that provide the user with useful information about project status and memory requirements.
STM32CubeIDE also includes standard and advanced debugging features including views of CPU core registers, memories, and peripheral registers, as well as live variable watch, Serial Wire Viewer interface, or fault analyzer.
Other IDEs that support ARM Cortex:
- ARM®, Atollic TrueSTUDIO®: was bought by ST, included in STM32CubeIDE
- Keil™, MDK-ARM™: only free for STM32F0 and STM32L0 processes
- Altium®, TASKING™ VX-toolset: paid license
- IAR™, EWARM (IAR Embedded Workbench®): paid license
Installation#
Download STM32CubeIDE STM32CubeIDE User Manual
During the installation, please be sure to install ST-LINK and SEGGER J-Link drivers.
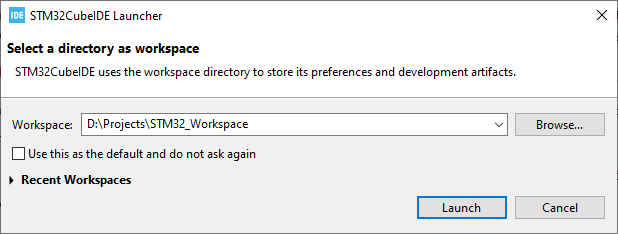
Create a workspace#
When start the program, it will ask to select a directory as a workspace — the location to save projects. Consider to make new workspaces for different big projects.
Workspace settings
Each workspace has its own settings configured in the Windows → Preferences menu.
- General → Editor → Text Editor
-
Due to the generated code from STM32CubeMX is 2-space tab width, it is better to configure the Text Editor to adapt with the tab width behavior:
- Displayed tab width: 2
- Insert spaces for tabs: Checked
- Remove multiple spaces on backspace/delete: Checked
- C/C++ → Build → Code Analysis
-
There are some options for under the. I recommended to enable some check for Potential Programming Problems:
- Assignment in condition:
if(a=b){} - Assignment to itself:
var = var; - No return in a function which is declared to return a value:
int func(){} - Return without value:
int func(){ return;} - Return the address of a local variable:
int* func(){int a; return &a;} - Virtual method call in constructor/ destructor
- Assignment in condition:
- C/C++ → Code Style → Formatter
-
Next is the formatting style:
- Create a new profile from K&R
- In the Indentation:
- Change Tab Policy to Space Only; then set Indentation size and Tab size both to 2.
- Indent is activated for all cases except empty lines
- In the Control Statement:
- Insert new line for all control statements
- Terminal
- Finally, it should increase the buffer for terminals in Terminal option to 1000 or more.
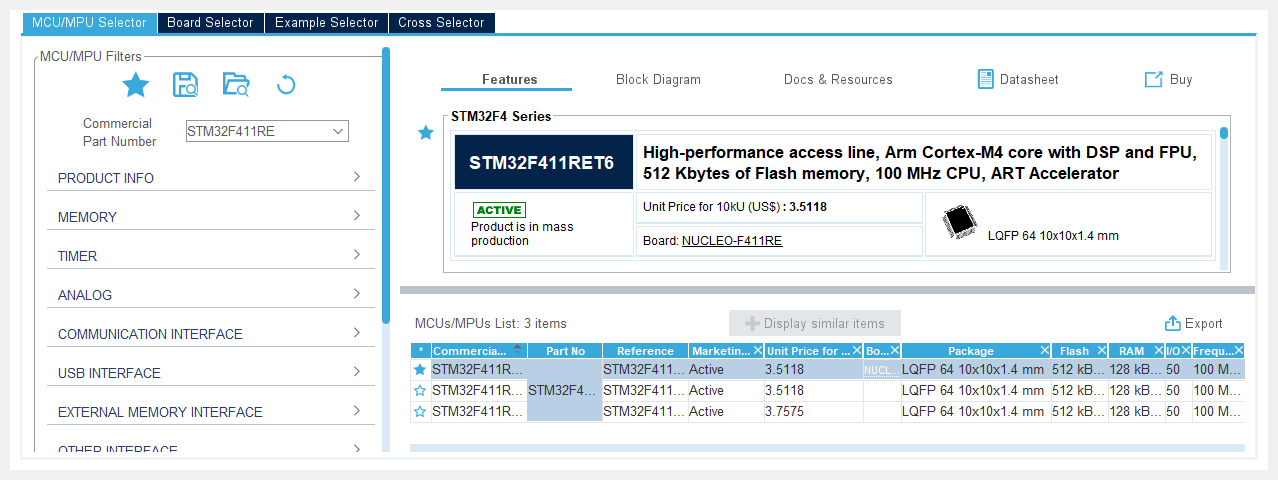
Create a project#
When start a new STM32 project, IDE shows up the Device Finder screen first. There are options to select the target MCU/MPU by name, board, example, and cross-reference.
After selecting the microprocessor, it’s time to name the project, and then select the targeted project type:
-
STM32Cube: CubeMX will help you to configure the projects, and it also generates source code for all settings you choose. Refer to the Blink project using LL or HAL.In this option, you can choose the STM32Cube MCU packages version for the selected target. For example, it is STM32Cube FW_F4 V1.27.0 for the STM32F4 MCUs.
-
Empty: you will start with minimal source code, and you have to configure the target chip manually. Refer to the Blink project using Register-based or CMSIS.
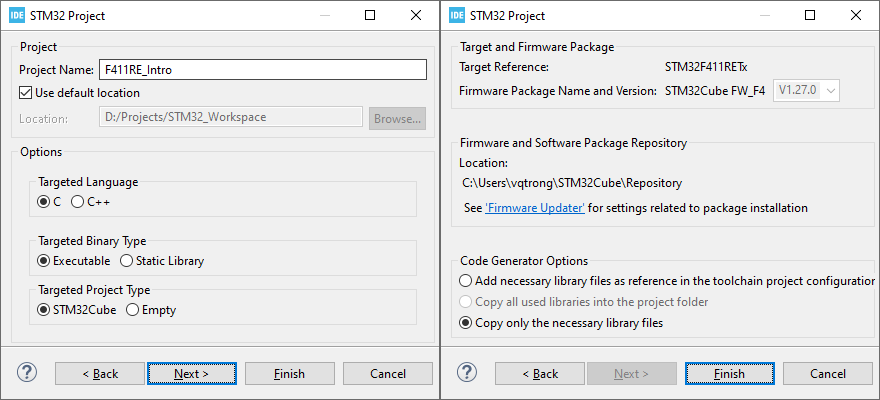
Press on Finish then IDE will run a screen named Device Configuration Tool from the STM32CubeMX tool, in there, it’s easy to enable any supported features in graphical mode. If the selected target is a development board, this tool will ask to use a default system config for the target board — usually including ST-Link pins, on-board buttons, LEDs, USB connect.
STM32CubeMX#
STM32CubeMX is a graphical tool that allows a very easy configuration of STM32 microcontrollers and microprocessors, as well as the generation of the corresponding initialization C code for the Arm® Cortex®-M cores.
STM32CubeMX allows the user to create, save and load previously saved projects. MCU configuration .ioc file is saved in the project folder, and user can open it in the STM32CubeMX for editing.
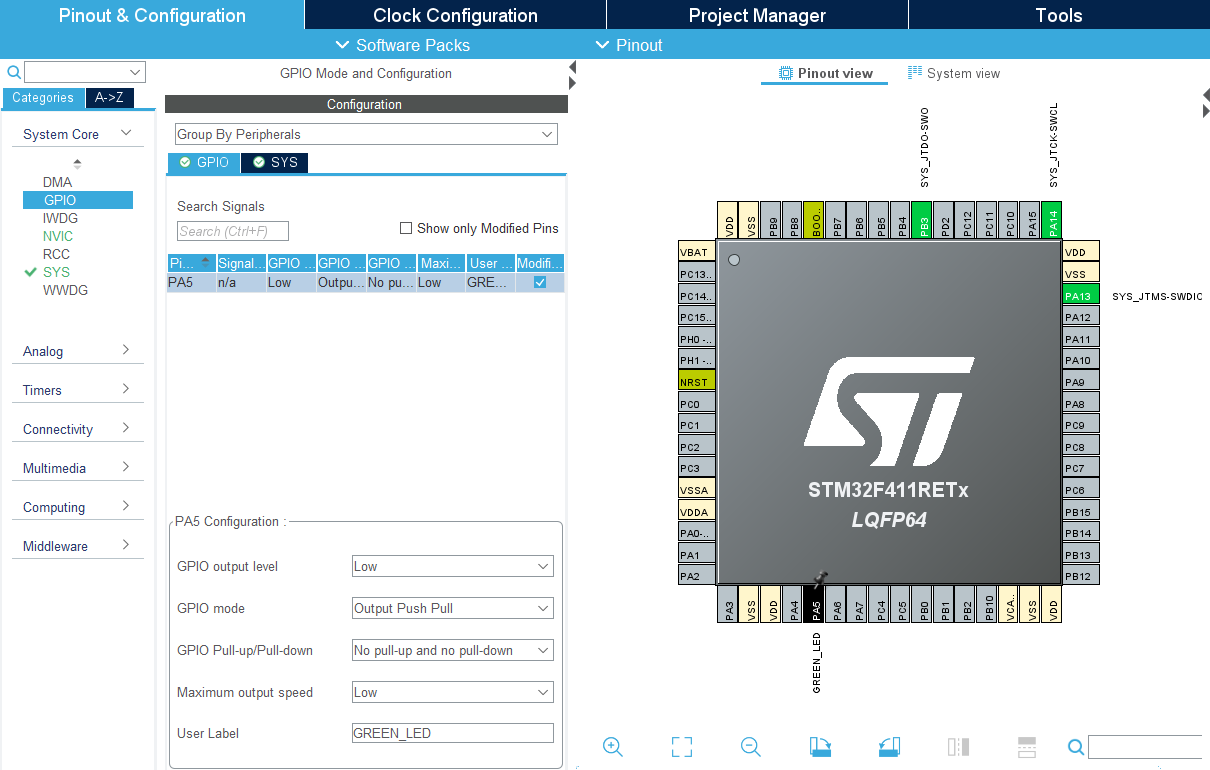
Pinout Configuration#
This tab shows available Components in categories or in A-Z list. Select on a component will show its Configuration screen.
The large Pinout view shows a graphic representation of the pin assignment. Left-click to select the function, and Right-click to do extra actions such as assigning a custom name.
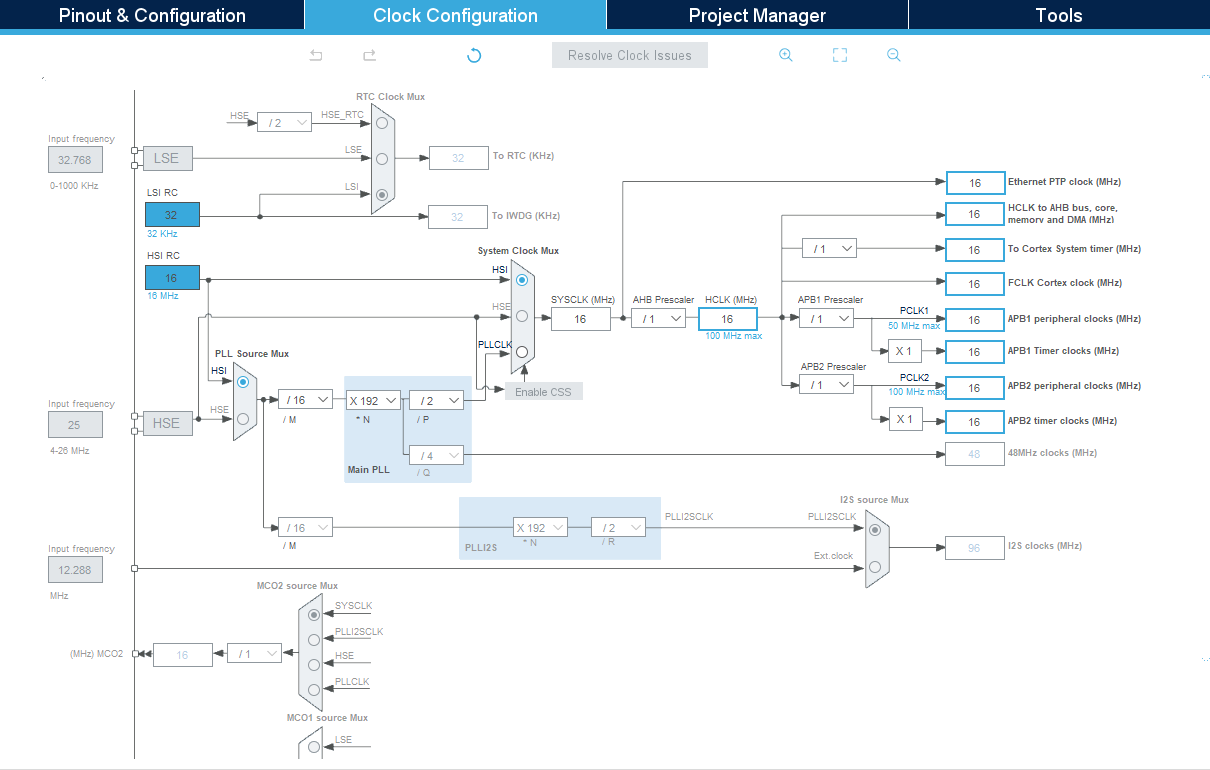
Clock Configuration#
This tab provides a schematic overview of the clock paths, clock sources, dividers, and multipliers. Drop-down menus and buttons can be used to modify the actual clock tree configuration, to meet the application requirements.
IDE has ability to automatically calculate multipliers and dividers to provide requested frequency, user can set a desired frequency in the clock node, and press enter, then IDE will re-configure the PLL, prescaler. The frequency on each node can be locked via the right-click menu.
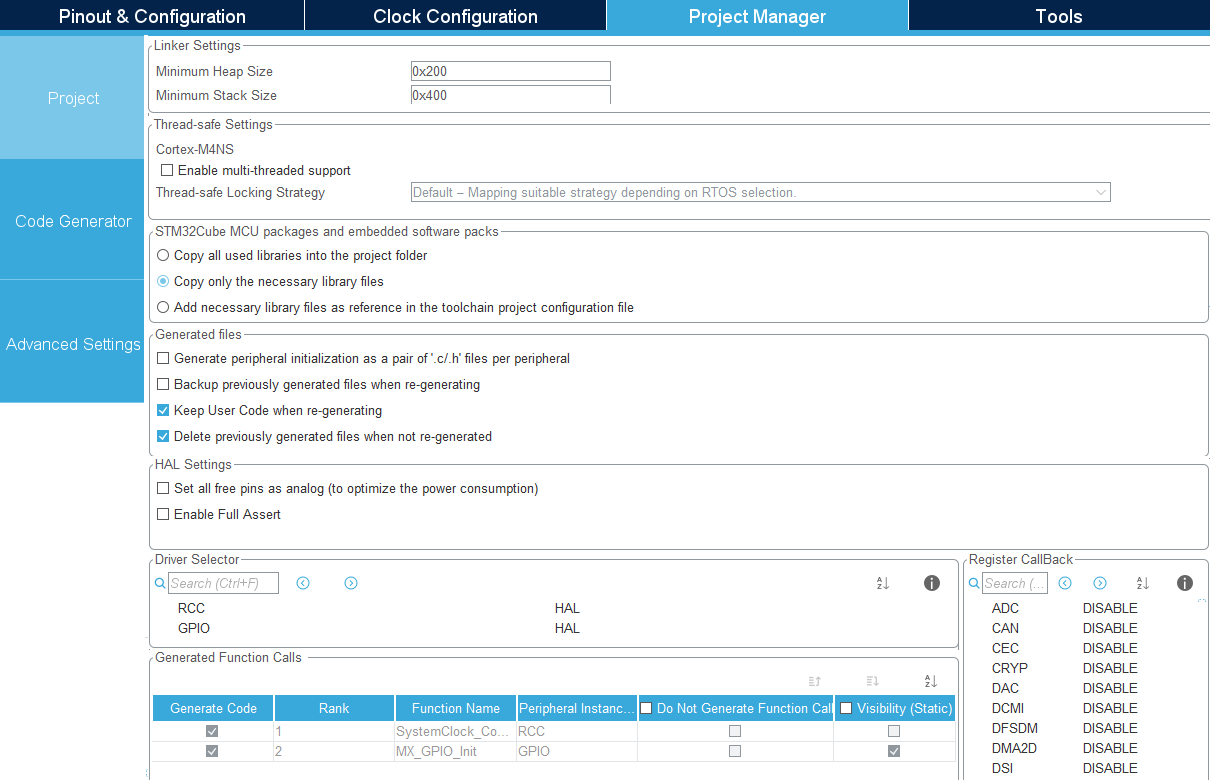
Project Manager#
This tab provides information about general project setting: to specify the project name, location, tool chain, and firmware version. It also has configs for code generation options such as the location of peripheral initialization code, library copy/link options, and to select templates for customized code.
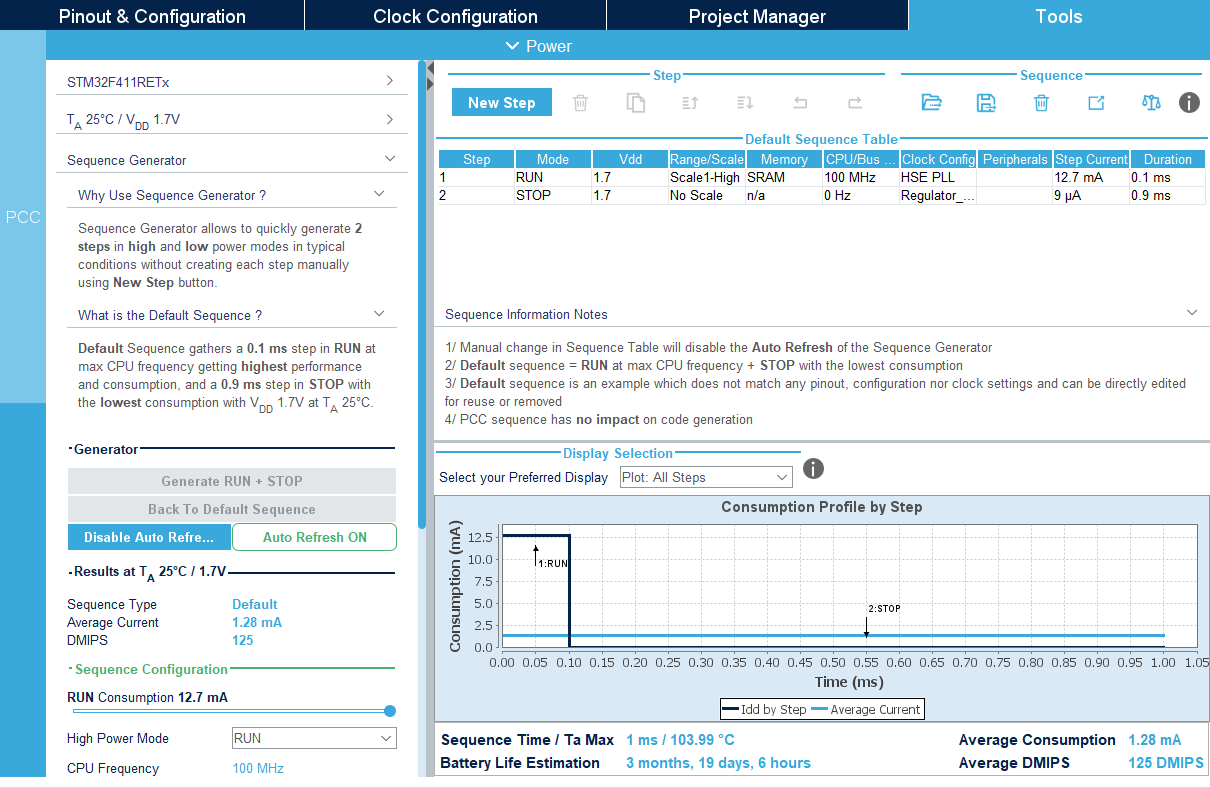
Extra Tools#
There are some provided tools which can be used to analyze or estimate the power consumption. You can see the RUN/ SLEEP modes with different clock frequency, peripheral status, and duration. It has a chart to visualize the power consumption profile for better understanding.
Code generation#
Generate code or Write your own code?
High-level or Low-Level programming?
There are many topics on the internet discussing about how to learn MCU though generated code or through self-written bare-metal/register-based code.
Here is my opinion to learn MCU which I’ve followed to get better understanding:
- First, start with bare-metal/ register-based programming
-
This step requires you to read document carefully, to understand every bit of the hardware configurations and how they will work.
At this step, you should work on small application only, on simple peripherals first.
- Second, work with Low-level Library (CMSIS, LL)
-
At this step, you should use an abstraction layer to reduce your own code. This also makes your code portable, reusable, and usually more coverage rate. Low-Level Lib also uses register-based programming. You can use LL as reference for the first step.
Cortex Microcontroller Software Interface Standard (CMSIS) can be used at this stage. ST also provides LL Library for this purpose. ST LL can be integrated in Code generation.
- Third, work with High-level Library (HAL)
-
In more complicated projects, Hardware-Abstraction Layer (HAL) is used for a quick development. HAL is preferred to use in production as it is built and test in long time, and of course, it reduces time-to-market. However, HAL is big, and make your application slower. It’s also hard to debug due to overriding or function pointers.
ST provides HAL Lib, and this lib is integrated with Code generation. Another open source HAL for STM32 is
libopencm3.
Refer to the Blink project to get the overview of what you have to do in either registered-based code or generated code.
After configuring pins, save the settings first and then start generating code. Manually request to generate code by pressing Alt + K or choosing menu Project → Generate Code. The tool will create sub-folders and add necessary files into project. The general file structure is:
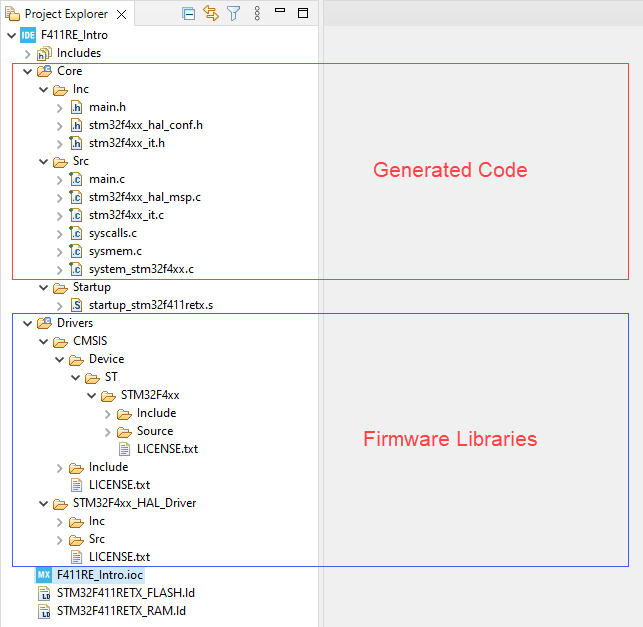
When chosen to use a Firmware Library in the project, IDE automatically uses ST Hardware Abstract Layer (HAL) library as the main way of controlling the processor and peripherals. HAL also makes use of Cortex Microcontroller Software Interface Standard (CMSIS) library to access processor’s registers. In the Project Manager tab, it can change to use Low-Level (LL) library instead of HAL.
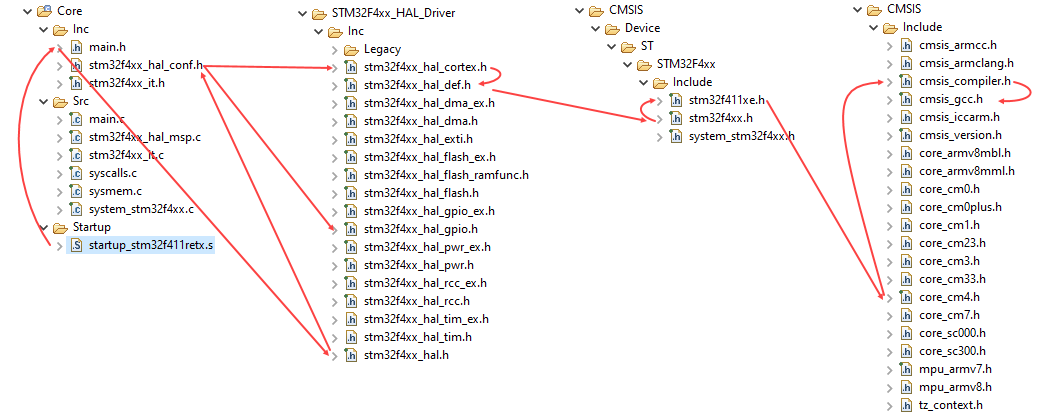
Code dependency starts from the main.h source file. This file includes HAL files which eventually includes CMSIS files. The main function is called from the startup file startup_*.s.
A HAL driver includes the following set of files:
| File | Description |
|---|---|
stm32f4xx_hal.h/.c |
This file is used for HAL initialization and contains DBGMCU, Remap and Time Delay based on SysTick APIs. This also include stm32f4xx_hal_def.h. |
stm32f4xx_hal_def.h |
Common HAL resources such as common define statements, enumerations, structures and macros. This includes CMSIS headers. |
stm32f4xx_hal_ppp.h/.c |
Main peripheral/module driver file. It includes the APIs that are common to all STM32 devices, example: stm32f4xx_hal_adc.c, stm32f4xx_hal_irda.c |
stm32f4xx_hal_ppp_ex.h/.c |
Extension file of a peripheral/module driver. It includes the specific APIs for a given part number or family, as well as the newly defined APIs that overwrite the default generic APIs if the internal process is implemented in different way, for example: stm32f4xx_hal_adc_ex.c, stm32f4xx_hal_flash_ex.c. |
The minimum files required to build an application using the HAL are listed in the table below:
| File | Description |
|---|---|
startup_stm32f4xx.s |
Tool chain specific file that contains reset handler and exception vectors. For some tool chains, it allows adapting the stack/heap size to fit the application requirements |
system_stm32f4xx.c |
This file contains SystemInit() which is called at startup just after reset and before branching to the main program. It does not configure the system clock at startup (contrary to the standard library). This is to be done using the HAL APIs in the user files. It allows relocating the vector table in internal SRAM. |
stm32f4xx_hal_conf.h |
This file allows the user to customize the HAL drivers for a specific application. It is not mandatory to modify this configuration. The application can use the default configuration without any modification. This call to STM32F0 HAL headers. |
stm32f4xx_hal_msp.c |
This file contains the MSP initialization and de-initialization (main routine and callbacks) of the peripheral used in the user application. |
stm32f4xx_it.h/.c |
This file contains the exceptions handler and peripherals interrupt service routine, and calls HAL_IncTick() at regular time intervals to increment a local variable (declared in stm32f0xx_hal.c) used as HAL time base. By default, this function is called each 1ms in SysTick ISR. The PPP_IRQHandler() routine must call HAL_PPP_IRQHandler() if an interrupt based process is used within the application. |
main.h/.c |
This file contains the main program routine, mainly: • call to HAL_Init() • set system clock configuration declare peripheral HAL initialization user application code. |
Add user code#
User code sections are marked with a pair of phrases /* USER CODE BEGIN x */ and /* USER CODE END x */. User code inside those marks are kept remaining during code generation.
I am going to add a variable counter with type of char, then inside the main while loop in the main() function, increase it by 1 after 100ms. Don’t mind the HAL function at this time.
/* USER CODE BEGIN PV */
char counter = 0;
/* USER CODE END PV */
int main(void) {
  /* other setup function */
  /* USER CODE BEGIN WHILE */
  while (1) {
    counter++;
    HAL_Delay(100);
    /* USER CODE END WHILE */

    /* USER CODE BEGIN 3 */
  }
  /* USER CODE END 3 */
}
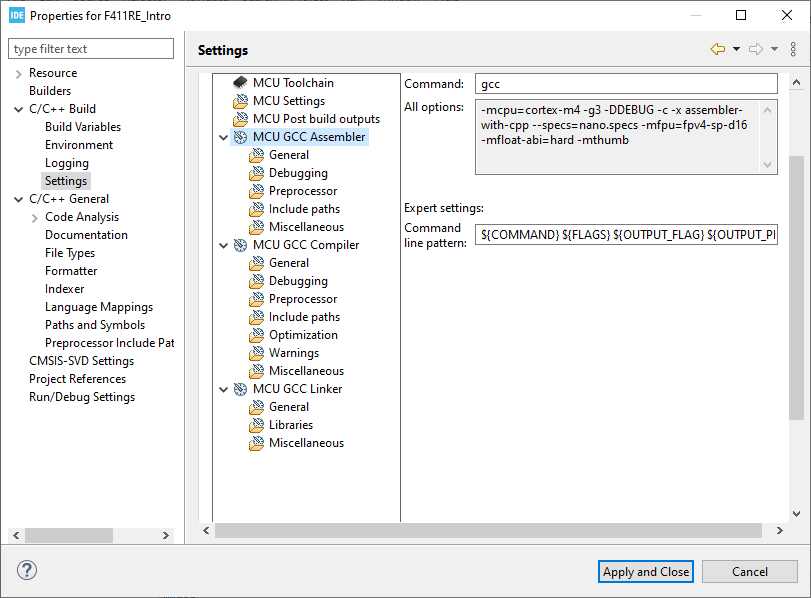
Compiler options#
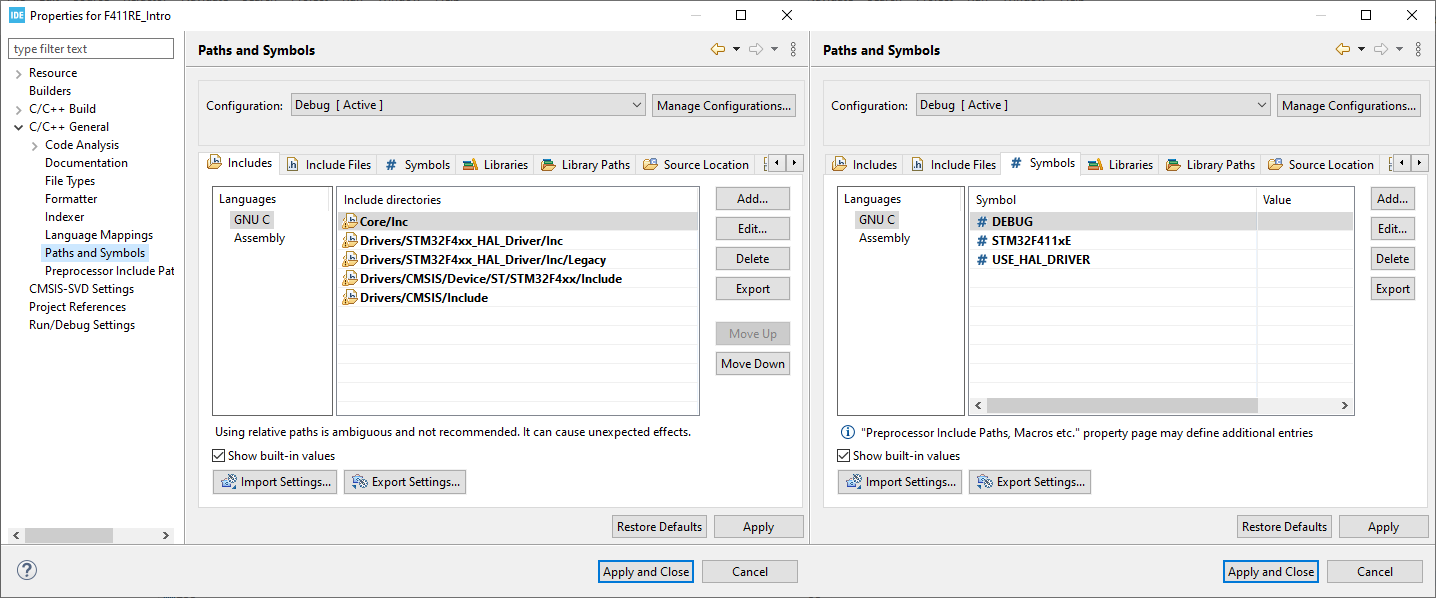
Project has options for the compiler under its properties. Right-click on the project name in the right panel, then select Properties menu.
The default included folders are all the folders created in the project by the STM32CubeMX tool. There are also some symbols created for the project build, such DEBUG mode, the MCU name STM32F411xE, and the macro USE_HAL_DRIVER if the project is generated with HAL firmware.
Then in the Build Options, there are options to be used by GCC compiler, GNU Linker, GNU Assembler. For details, you can refer to the Blink project.
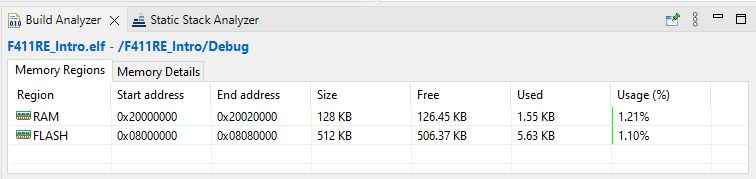
Build Project#
Build the application by pressing Ctrl + B, or in menu Project → Build All. There are some reports about the resource usage to check after the compilation. The first thing it reports is the memory usage, in terms of RAM and FLASH free space.
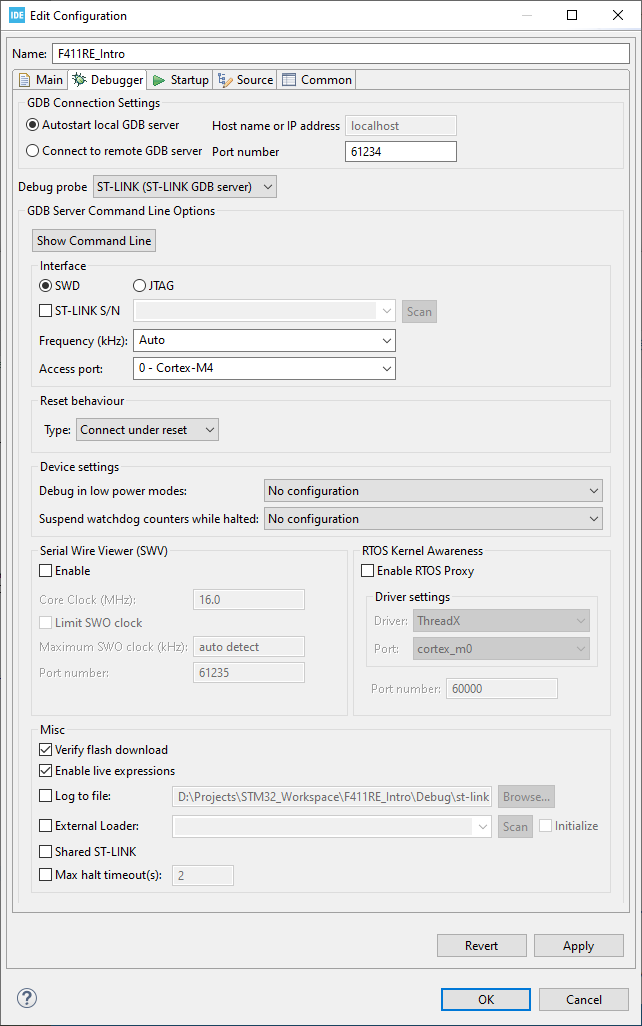
Setup debugger#
Before Run or Debug on the target chip, it is needed to configure the programming/ debugging interface. By default, the application code can be programmed through the debugger interface, therefore, in Run Config or Debug Config, there is a tab named Debugger to select:
- Debug Probe: ST-LINK GDB, ST-LINK OpenOCD, SEGGER J-LINK, or other available probes
- Interface: SWD or JTAG. If there are multiple boards connected, use debugger board Serial Number to choose the correct target
- Advanced features:
- Serial Wire Viewer: read data from MCU in a dedicated SWO pin, available on Cortext-M3 and above
- Live Expression: read out the value at a memory address without halting the CPU
Run Mode#
In the Run Mode, IDE flashes the firmware via the Debugging interface, and then disconnect the debugger to make the target board run freely. Just use the menu Run → Run.
Debug Mode#
Putting the target under the Debug Mode is to control its execution, step by step. Breakpoint is where the CPU will be halted and debugger will inspect its current status: registers, memory values.
By default, the first breakpoint is right after entering the main function. The start address and the first break point can be set in the Startup tab in Debug Configurations.
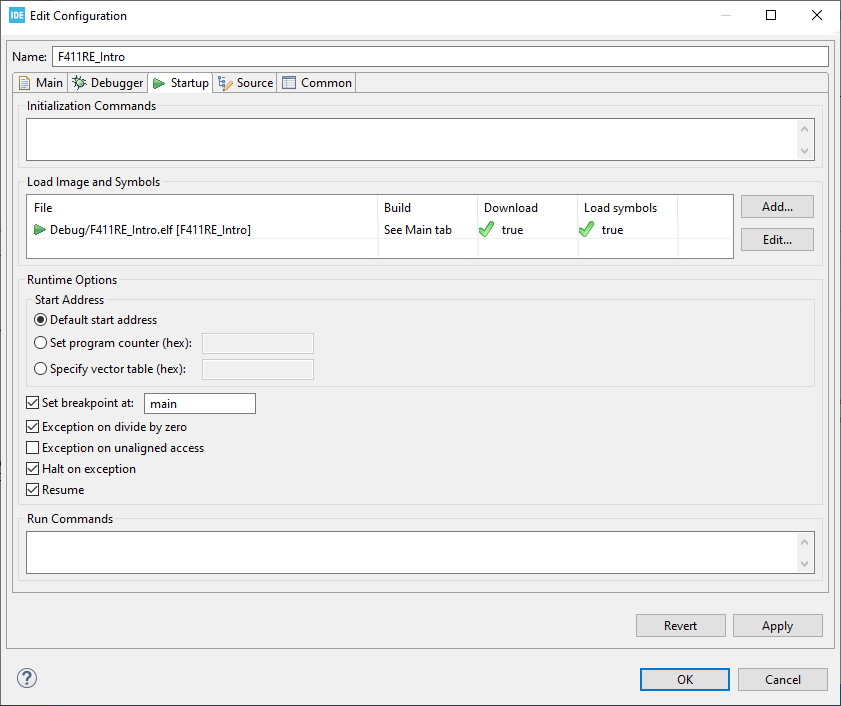
When CPU is halted at a breakpoint, user can control the execution step by step, through the commands or buttons:

STM32CubeProgrammer#
Download STM32CubeProgrammer STM32CubeProgrammer User Manual
STM32CubeProgrammer (previous name was ST-Link Utility) provides an easy-to-use and efficient environment for reading, writing and verifying device memory through both the debug interface (JTAG and SWD) and the bootloader interface (UART, USB DFU, I2C, SPI, and CAN). STM32CubeProgrammer offers a wide range of features to program STM32 internal memories (such as Flash, RAM, and OTP) as well as external memories.
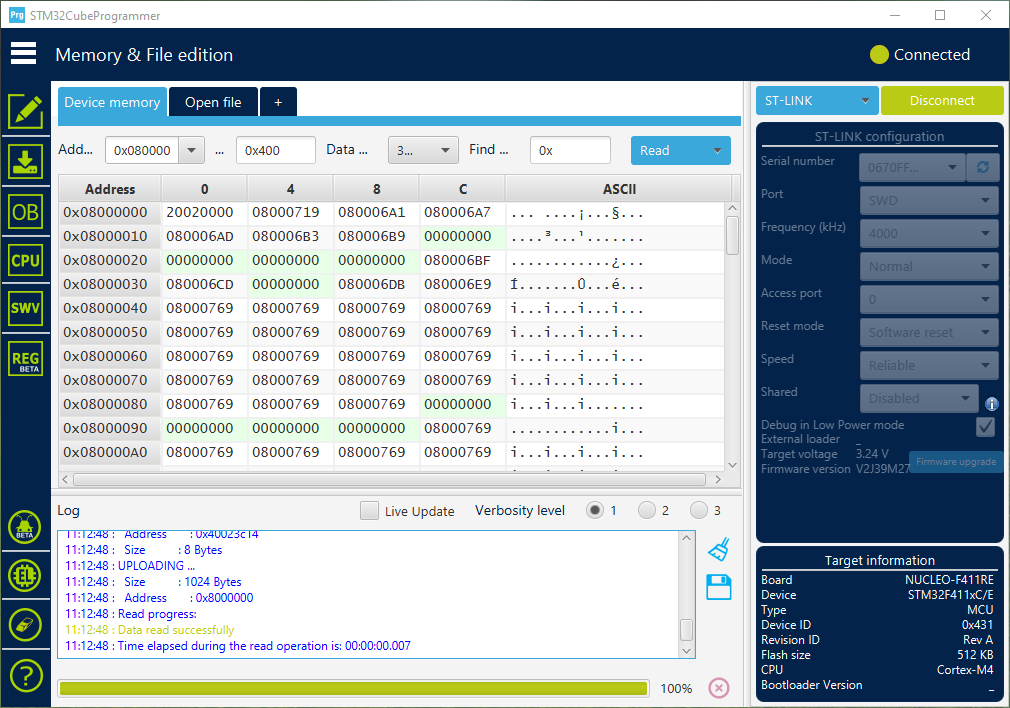
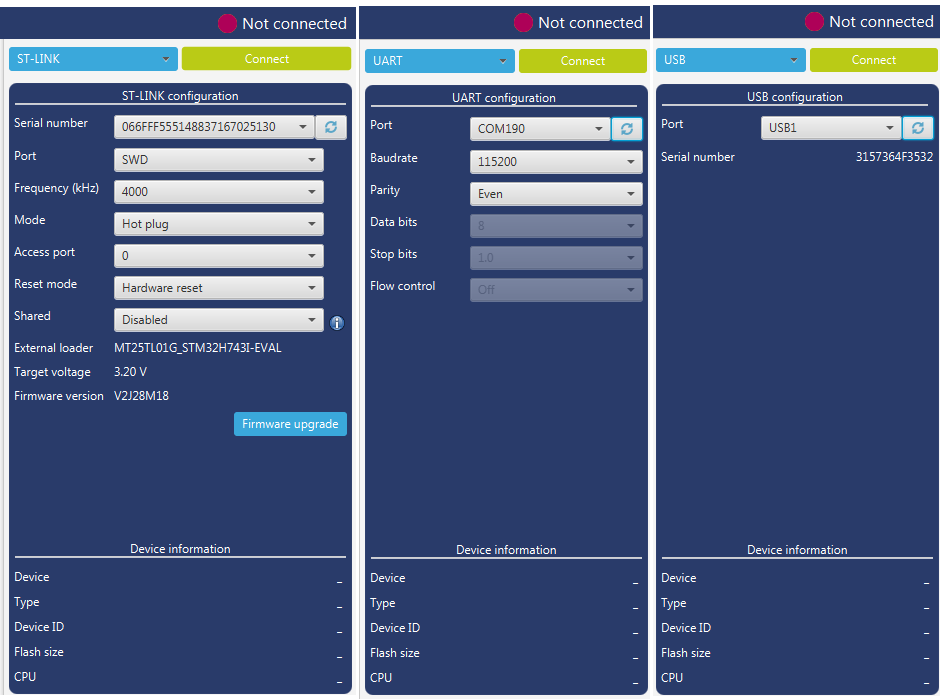
Target connection#
On the original development boards, please select ST-LINK interface, and then select either SWD or JTAG port.
If the custom board has a USB port with Device Firmware Update mode, it can be connected on the USB interface. Before pressing Connect on the software, find on the board to press and hold the Boot button (Boot0 or Boot1) and press Reset button (NRST) to make device run into DFU mode.
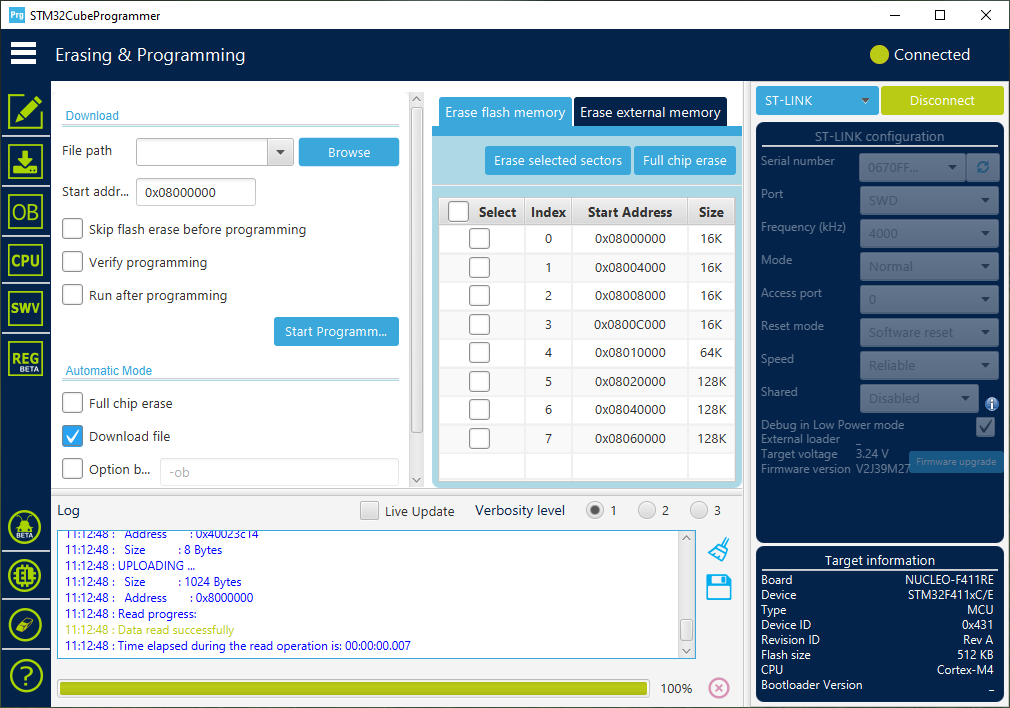
Erase and Program#
Once connected to a target, the memory sectors are displayed in the right-hand panel showing the start address and the size of each sector. To erase one or more sectors, select them in the first column and then click on the Erase selected sectors button.
To download firmware to the target chip, select the Erasing & Programming tab. Click on the browse button and select the file to be programmed. The file format supported are binary files (.bin), ELF files (.elf, .axf, .out), Intel hex files (.hex) and Motorola S-record files (.srec).
In case of programming a binary file, the address must be set.
Other features#
Other advanced features will be covered in other posts. Here is the list of those features:
- Option Bytes
- CPU Instruction debug
- Serial Wire View
- Fault Analyzer
- External Flash programming
STM32CubeMonitor#
Download STM32CubeMonitor STM32CubeMonitor Guide
The STM32CubeMonitor helps to fine-tune and diagnose STM32 applications at run-time by reading and visualizing their variables in real-time. It provides a flow-based graphical editor to build custom dashboards simply, and quickly add widgets such as gauges, bar graphs and plots. With non-intrusive monitoring, STM32CubeMonitor preserves the real-time behavior of applications, and perfectly complements traditional debugging tools to perform application profiling.
This tool use SWD/JTAG interface to access the memory addresses and read their value.
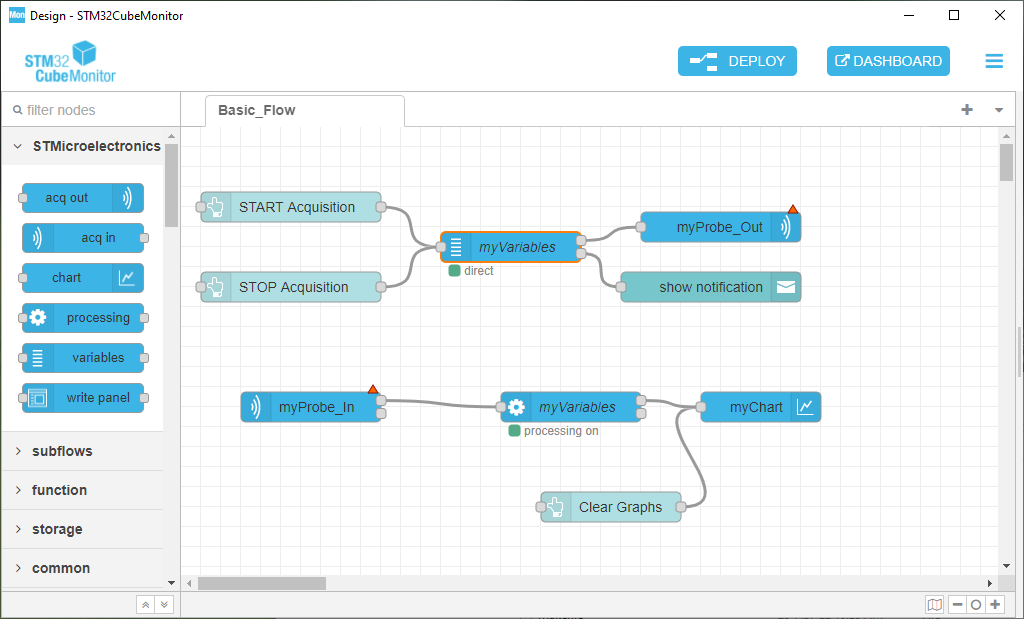
When start the tool, there is a basic flow created with:
- Start/ Stop/ Clear buttons
- myVariables block holds the addresses under monitoring
- myProbe_Out block has configs to connect to the target device through debug interface
- myProbe_In block has script to read the value of the addresses listed in the myVariables block
- myVariables processing block read the captured value and process it
- myChart displays the dashboard which visualizes the processed data
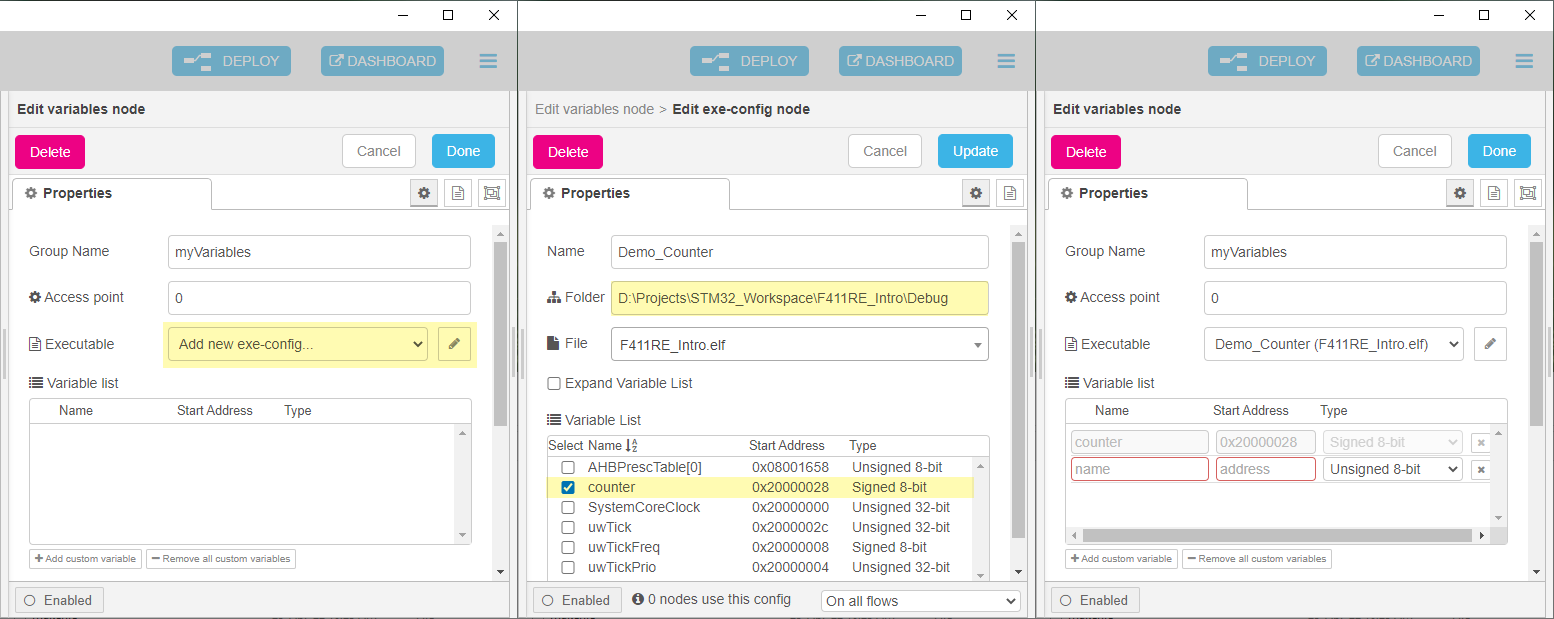
To configure a block, double-click on it, and follow the guide. The steps go through file selection, variable list, connect probe, and assign probe.
To demonstrate how it works, we will visualize the counter variable which is defined as a global variable in the main.c file. This variable is creased every 100 ms in the main while loop.
Select variable
Double click on the myVariables node, and add the .elf file, select counter variable.
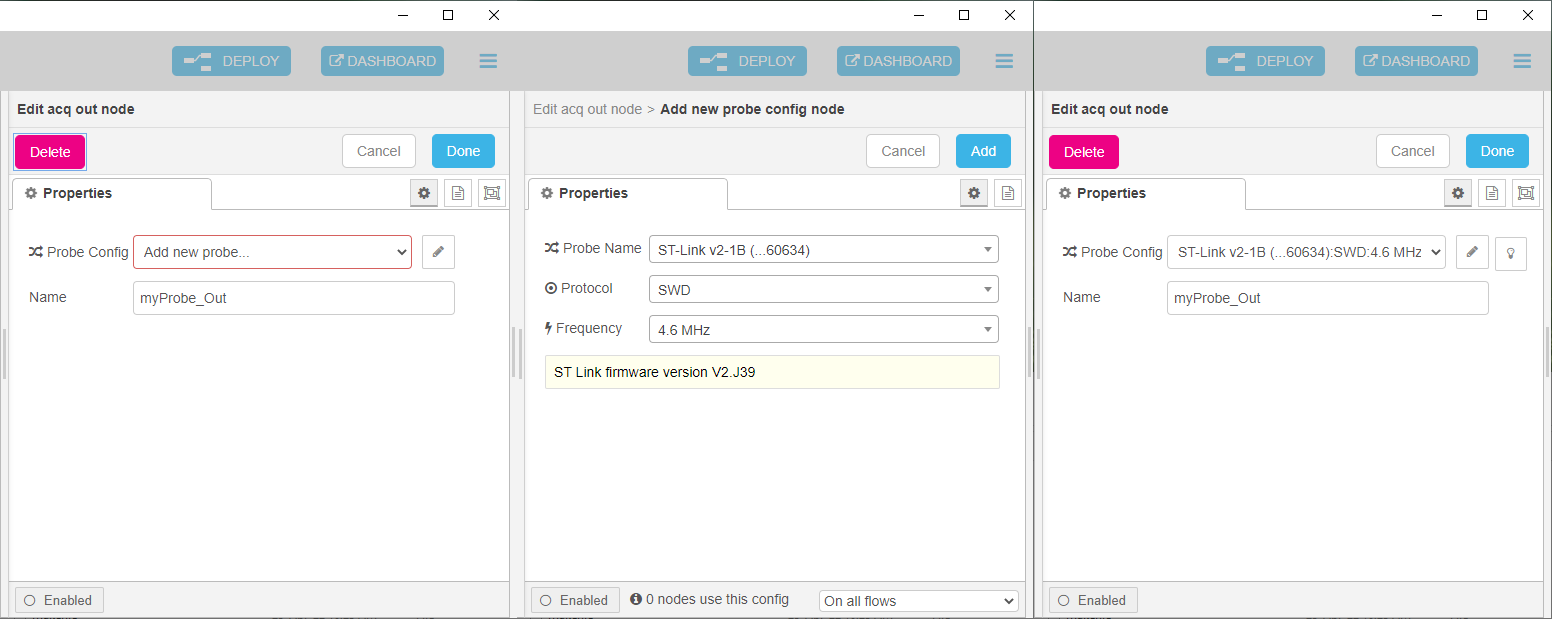
Select probe
Connect the target board via ST-LINK or other SWD/ JTAG compatible debugger. The debugger will be shown as a probe in the myProble_Out node. You can choose the same proble for the myProbe_In node.
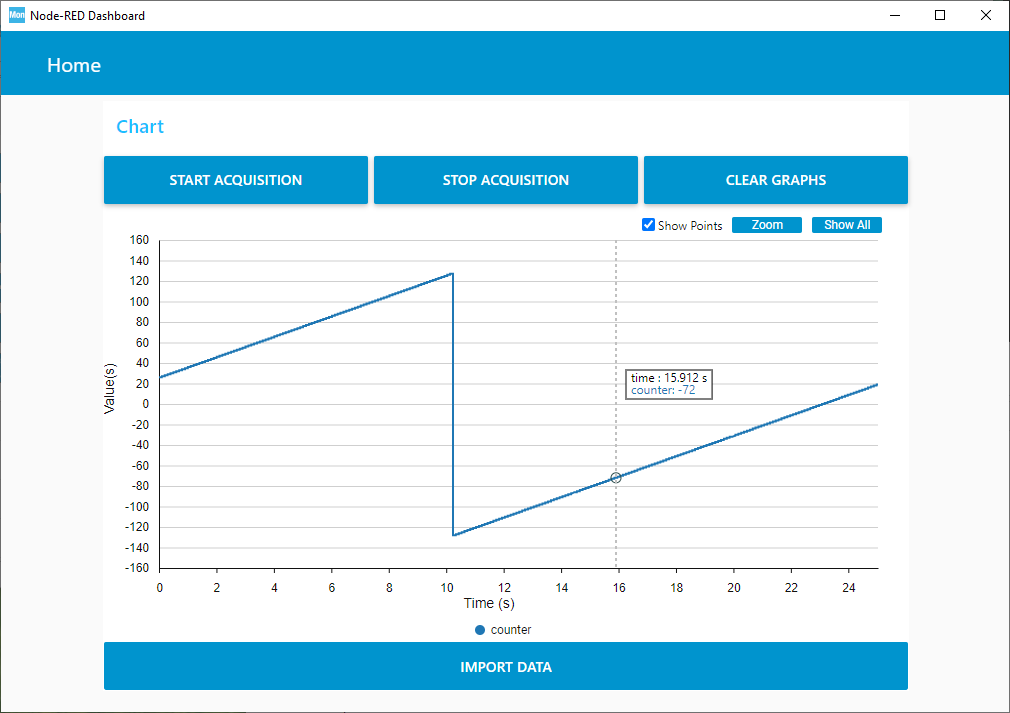
The chart can be drawn in line or bar chart. At this time, just use a default one.
Deploy and run the Dashboard
Finally, press on Deploy to configure the probes, and then click on Dashboard to show the graphical interface.
Start button will send start message to the probe and variable processing block. The captured data will be drawn on the chart.
Other tools#
There are many other tools that work on ARM cores. I will have other posts to share about those tools such as Cross-Compiler, Config File, Make File, or System View.