Monitor the Resource Usage of a Process
This post presents a custom script to execute a process and monitor the CPU and Memory usage of that process using linux utilities such as top, grep, and awk. The result is exported to a text file, and optionally an image if gnuplot is installed.
Last update: 2022-06-04
Table of Content
The final script
Download monitor.sh then save to ~/monitor.sh.
Add below line to ~/.bashrc:
source monitor.sh
Usage:
monitor "title" program parameters
This post is written as a walk through guide, step by step, to help to understand how the script was made.
Export a function in bash#
In a bash file, a function with a name and its body can be defined and then exported with export -f command:
#!/bin/bash
myfunc() {
    echo "parameters: $@"
}
export -f myfunc
To make function available outside the script, run source command before calling the function:
source myfunc.sh
myfunc abc
All parameters are implicit saved into local macros.
Refer to Advanced Bash-Scripting Guide:
| Macro | Description |
|---|---|
$BASHPID |
Process ID of the current instance of Bash. This is not the same as the $$ variable, but it often gives the same result. |
$PPID |
Process ID of the parent process |
$$ |
Process ID of the script itself |
$! |
Process ID of last job run in background |
$PWD |
The current directory that process is in at the time |
$SECONDS |
The number of seconds the script has been running |
$1, $2, $n |
The first, the second and the n-th parameter |
$# |
The number of command-line arguments |
$* |
All the positional parameters, seen as a single word, must be quoted |
$@ |
Same as $*, but each parameter is a quoted string, that is, the parameters are passed on intact, without interpretation or expansion. This means, among other things, that each parameter in the argument list is seen as a separate word |
$? |
Exit status of a command, function, or the script itself |
Command-Grouping#
Refer to Bash Manual — Command Grouping.
Bash provides two ways to group a list of commands to be executed as a unit. When commands are grouped, re-directions may be applied to the entire command list.
( list )- Placing a list of commands between parentheses causes a sub-shell environment to be created (see Command Execution Environment), and each of the commands in list to be executed in that sub-shell. Since the list is executed in a sub-shell, variable assignments do not remain in effect after the sub-shell completes.
{ list; }-
Placing a list of commands between curly braces causes the list to be executed in the current shell context. No sub-shell is created. The semicolon (or newline) following list is required.
In addition to the creation of a sub-shell, there is a subtle difference between these two constructs due to historical reasons:
- The braces are reserved words, so they must be separated from the list by blanks or other shell meta-characters
- The parentheses are operators, and are recognized as separate tokens by the shell even if they are not separated from the list by whitespace
Run a process#
The basic idea is to run a process in background and while it’s running, report its resource usage:
#!/bin/bash

monitor() (
    # run process in background
    echo "Executing $*"
    $* &

    # get PID of last job in background
    pid=$!
    echo "Executed in PID: $pid"
    ps --no-headers -p $pid

    echo 'CPU  MEM'
    # check if a process is running
    while [ -e /proc/$pid ]
    do
        # use ps to get cpu and memory usage
        ps --no-headers -o '%cpu,%mem' -p $pid
        sleep 1
    done
)

export -f monitor
ps or top#
Both ps and top report CPU Usage, but the returned values are different.
Let’s check the manual of each command:
ps-
CPU usage is currently expressed as the percentage of time spent running during the entire lifetime of a process. This is not ideal, and it does not conform to the standards that
psotherwise conforms to. CPU usage is unlikely to add up to exactly 100%.It means
psdoes not show the instant CPU usage, it shows an average CPU usage over the lifetime of the process. top-
%CPU – CPU Usage, The task’s share of the elapsed CPU time since the last screen update, expressed as a percentage of total CPU time.
It means if interval is 1 second,
topwill report CPU usage for the last 1 second. That can be considered as instant report.Let’s check
top‘s options-b: Batch-mode operation- Starts top in Batch mode, which could be useful for sending output from top to other programs or to a file. In this mode, top will not accept input and runs until the iterations limit set with the `-n’ command-line option or until killed.
-d: Delay-time interval as:-d ss.t(secs.tenths)- Specifies the delay between screen updates, and overrides the corresponding value in one’s personal configuration file or the startup default. Later this can be changed with the
dorsinteractive commands. -p: Monitor-PIDs mode as:-pN1 -pN2 ...or-pN1,N2,N3 ...- Monitor only processes with specified process IDs.
Switch to use top get the process information:
#!/bin/bash

monitor() (
    # run process in background
    $* &

    # get PID of last job in background
    pid=$!

    # use top to monitor the process
    top -b -d 1 -p $pid &

    # save top PID to control it
    toppid=$!

    echo 'CPU  MEM'
    # check if a process is running
    while [ -e /proc/$pid ]
    do
        sleep 1
    done

    # kill top
    sleep 1
    kill -9 $toppid
)

export -f monitor
Run a test:
monitor ffmpeg -y -hide_banner -i /dev/video0 -c:v h264_omx -t 10 test.mp4
and the result:
PID  USER PR  NI VIRT   RES    SHR    S  %CPU  %MEM   TIME+   COMMAND
2286 pi   20  0  336612 129848 121960 R  34.5  52.5   0:03.36 ffmpeg
grep and awk#
Refer to grep manual
Use grep to extract process information lines using pid number as the keyword:
top -b -d 1 -p $pid | grep $pid &
Refer to awk manual
Use awk to cut out 2 columns: %CPU and %MEM (at the 9th and 10th column) from the filtered lines:
top -b -d 1 -p $pid | grep $pid | awk '{print $9, $10}' &
So, this is a modified version:
#!/bin/bash

monitor() (
    # run process in background
    $* &

    # get PID of last job in background
    pid=$!

    # use top to monitor the process
    # use grep to catch useful lines
    # use awk to extract data columns
    top -b -d 1 -p $pid | grep $pid | awk '{print $9, $10}' &

    # save top PID to control it
    toppid=$!

    echo 'CPU  MEM'
    # check if a process is running
    while [ -e /proc/$pid ]
    do
        sleep 1
    done

    # kill top
    sleep 1
    kill -9 $toppid
)

export -f monitor
Run a test command:
monitor ffmpeg -y -hide_banner -i /dev/video0 -c:v h264_omx -t 10 test.mp4
and the result:
CPU MEM
Bug: No output value
Surprisingly, there is no output for CPU and MEM usage reported in the output.
Search on google, there is a glue of missing data when using grep in a pipeline.
Line buffered mode#
When using pipeline of commands, there is pipeline buffer between them.
The output from grep is no longer line buffered, but block buffered, usually the block is 4 KB, leading to the problem that the next awk command cannot see new data immediately on its input.
Notes from manuals:
--line-bufferedin grep manual- Use line buffering on output. This can cause a performance penalty.
-W interactivein awk manual- Set non-buffered writes to stdout and line buffered reads from stdin. Records from stdin are lines regardless of the value of RS.
Combining them together and testing again:
#!/bin/bash

monitor() (
    # run process in background
    $* &

    # get PID of last job in background
    pid=$!

    # use top to monitor the process
    # use grep to catch useful lines, use line buffered mode
    # use awk to extract data column, read input in line buffered mode
    top -b -d 1 -p $pid | grep --line-buffered $pid | awk -W interactive '{print $9, $10}' &

    # save top PID to control it
    toppid=$!

    echo 'CPU  MEM'
    # check if a process is running
    while [ -e /proc/$pid ]
    do
        sleep 1
    done

    # kill top
    sleep 1
    kill -9 $toppid
)

export -f monitor
Run a test:
monitor ffmpeg -y -hide_banner -i /dev/video0 -c:v h264_omx -t 10 test.mp4
and the result comes with expected values:
CPU  MEM
20.0 0.8
21.0 3.5
67.3 5.1
89.1 6.0
77.2 9.4
Save log with tee#
Use tee to read from the standard input and write to the standard output and a file.
That is simple enough to clone the output to a log file:
$* | tee log.txt &
top -b -d 1 -p $pid | grep --line-buffered $pid | awk -W interactive '{print $9, $10}' | tee usage.txt &
Then modify the script:
#!/bin/bash

monitor() (
    # run process in background
    $* | tee log.txt &

    # get PID of last job in background
    pid=$!

    # use top to monitor the process
    # use grep to catch useful lines, use line buffered mode
    # use awk to extract data columns, read input in line buffered mode
    top -b -d 1 -p $pid | grep --line-buffered $pid | awk -W interactive '{print $9, $10}' | tee usage.txt &

    # save top PID to control it
    toppid=$!

    echo 'CPU  MEM'
    # check if a process is running
    while [ -e /proc/$pid ]
    do
        sleep 1
    done

    # kill top
    sleep 1
    kill -9 $toppid
)

export -f monitor
Run a test:
monitor ffmpeg -y -hide_banner -i /dev/video0 -c:v h264_omx -t 10 test.mp4
Bug: Empty log and invalid output
After using tee, there are twp issues happened:
- an empty log.txt file
- the usage.txt content is invalid
Fix empty log#
When making pipeline to tee, only the STDOUT (1) is forwarded, while ffmpeg prints output on the STDERR (2) not on the STDOUT (1).
Fix it by redirect ffmpeg STDERR to STDOUT:
$* 2>&1 | tee log.txt &
Fix wrong data#
Add some debug lines ps -p $pid to check the process ID after creating the processes:
#!/bin/bash

monitor() (
    # run process in background
    $* | tee log.txt &

    # get PID of last job in background
    pid=$!
    ps -p $pid
    # use top to monitor the process
    # use grep to catch useful lines, use line buffered mode
    # use awk to extract data columns, read input in line buffered mode
    top -b -d 1 -p $pid | grep --line-buffered $pid | awk -W interactive '{print $9, $10}' | tee > usage.txt &

    # save top PID to control it
    toppid=$!
    ps -p $toppid

    echo 'CPU  MEM'
    # check if a process is running
    while [ -e /proc/$pid ]
    do
        sleep 1
    done

    # kill top
    sleep 1
    kill -9 $toppid
)

export -f monitor
Then, it prints out the PID of tee, not the PID of ffmpeg or top.
  PID TTY          TIME CMD
  647 pts/0    00:00:00 tee
  PID TTY          TIME CMD
  652 pts/0    00:00:00 tee
Get PID of a process in pipeline
In bash, pipeline cause commands to run in a sub-shell!
For example, $* | tee > log.txt & will run $* in a sub-shell, and tee > log.txt will run in current shell, therefore tee’s PID will be saved in the macro $!.
The solution is to save the PID in the newly created sub-shell in which $! returns correct PID, then load that PID later:
# save to pid.txt
($* 2>&1 & echo $! > pid.txt) | tee > log.txt &
# load from pid.txt
pid=$(<pid.txt)
Then modify the script:
#!/bin/bash

monitor() (
    # run process in background
    ($* 2>&1 & echo $! > pid.txt) | tee log.txt &

    # get PID of last job in background
    pid=$(<pid.txt)
    ps -p $pid
    # use top to monitor the process
    # use grep to catch useful lines, use line buffered mode
    # use awk to extract data columns, read input in line buffered mode
    (top -b -d 1 -p $pid & echo $! > pid.txt) | grep --line-buffered $pid | awk -W interactive '{print $9, $10}' | tee usage.txt &

    # save top PID to control it
    toppid=$(<pid.txt)
    ps -p $toppid

    echo 'CPU  MEM'

    # check if a process is running
    while [ -e /proc/$pid ]
    do
        sleep 1
    done

    # kill top
    sleep 1
    kill -9 $toppid

    # clean up
    rm pid.txt
)

export -f monitor
Run a test:
monitor ffmpeg -y -hide_banner -i /dev/video0 -c:v h264_omx -t 10 test.mp4
and got correct PIDs for ffmpeg and top:
  PID TTY          TIME CMD
 2352 pts/0    00:00:00 ffmpeg
  PID TTY          TIME CMD
 2360 pts/0    00:00:00 top
Graph with gnuplot#
Gnuplot is a portable command-line graph utility for Linux, OS/2, MS Windows, OSX, VMS, and many other platforms. It can produce many types of output, including terminal and file.
Terminal output
gnuplot -e " \
    set term dumb; \
    plot \
        'usage.txt' using 1 title '%CPU' with lines, \
        '' using 2 title 'MEM' with lines \
"
PNG Image output
gnuplot -e " \
    set term png size 640, 480; \
    set output 'usage.png'; \
    set grid xtics lc rgb '#bbbbbb' lw 1 lt 1; \
    set grid ytics lc rgb '#bbbbbb' lw 1 lt 1; \
    plot \
        'usage.txt' using 1 title '%CPU' with lines, \
        '' using 2 title 'MEM' with lines \
"
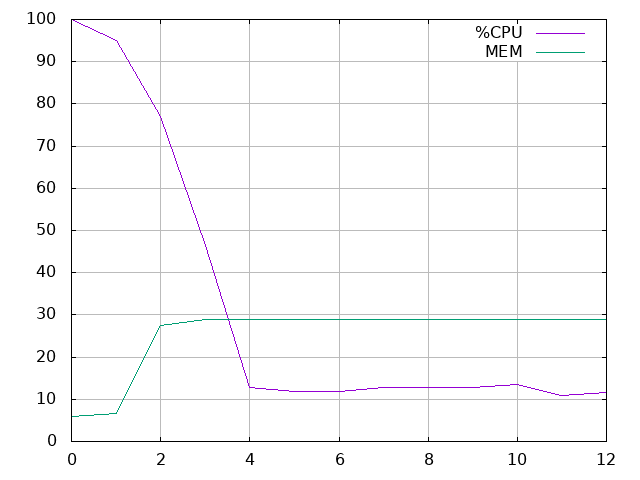
Run a test:
monitor "test" "ffmpeg -y -hide_banner -i /dev/video0 -c:v h264_omx -t 10 test.mp4"
It prints out a good graph in the terminal as well as in a PNG image:
100 +--------------------------------------------------------------------+
    |     ***   +          +           +          +           +          |
 90 |-+      *                                              %CPU ****** -|
    |         **                                             MEM ######  |
 80 |-+                                                                +-|
    |           *                                                        |
 70 |-+          *                                                     +-|
    |             *                                                      |
 60 |-+            *                                                   +-|
    |              *                                                     |
 50 |-+             *                                                  +-|
    |                *                                                   |
 40 |-+               *                                                +-|
    |                  *                                                 |
 30 |-+         #########################################################|
    |          #         *                                               |
 20 |-+      ##           *                                            +-|
    |       #              ******         *************************      |
 10 |-+    #                     *********                         ******|
    |######     +          +           +          +           +          |
  0 +--------------------------------------------------------------------+
    0           2          4           6          8           10         12
Some enhancements#
Some small modifications to make script run in multiple sessions:
1. Set title for a new session
Let’s modify the script to accept parameters in this format:
monitor "title" command
by extracting those parameters at the beginning of the script:
monitor() (
    # extract parameters
    title=$1
    command=${@:2} # get parameters from the 2nd one
    ...
)
The title will be used to name the session, to create a folder to save log files.
2. Save output to a separated folder
# create result folder if not existed
[ ! -d $title ] && mkdir $title
3. Change output format to CPU= X MEM= Y
It needs to change the data column index in gnuplot:
# *-usage.txt content:
# CPU= X MEM= Y
# X is at 2nd column,
# Y is at 4th column
gnuplot -e " \
    set term dumb; \
    plot \
        '${title}/${title}-usage.txt' using 2 title '%CPU' with lines, \
        '' using 4 title 'MEM' with lines \
    "
The final script#
Download monitor.sh then save to ~/monitor.sh.
Add below line to ~/.bashrc:
source monitor.sh
Usage:
monitor "title" program parameters