Serial Wire Viewer (SWD + SWO) - fast & native Debugging
Compared to other "debugging-alike" peripherals like UART/VCOM redirection or to other technologies like the ARM semihosting, Serial Wire Viewer is really fast. This method also allows to trace the system activities and memory without having big impaction on the performance.
Last update: 2022-06-29
Table of Content
STM32-Tutorials F411RE_SWV.zip
SWV setup
-
Connect a debugger via SWD + SWO interface
-
Override
_write()function in themain.cfile:/* Debug Exception and Monitor Control Register base address */ #define DEMCR *((volatile uint32_t*) 0xE000EDFCu) /* ITM register addresses */ #define ITM_STIMULUS_PORT0 *((volatile uint32_t*) 0xE0000000u) #define ITM_TRACE_EN *((volatile uint32_t*) 0xE0000E00u) /* Send a char through ITM */ void ITM_SendChar(uint8_t ch) { // read FIFO status in bit [0]: while(!(ITM_STIMULUS_PORT0 & 1)); // write to ITM stimulus port0 ITM_STIMULUS_PORT0 = ch; } /* Override low-level _write system call */ int _write(int file, char *ptr, int len) { int DataIdx; for (DataIdx = 0; DataIdx < len; DataIdx++) { ITM_SendChar(*ptr++); } return len; } -
In
mainfunction, enable ITM Trace:// Enable TRCENA DEMCR |= ( 1 << 24); // Enable stimulus port 0 ITM_TRACE_EN |= ( 1 << 0); -
Use a debugger or a software that can show messages from SWO pin
Debugging#
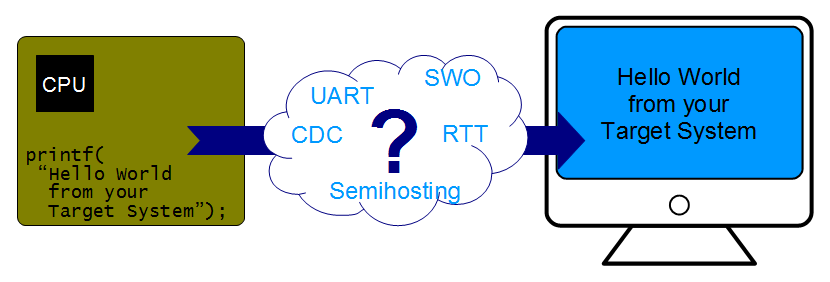
There are some debug techniques used to inspect the firmware running on ARM-based MCUs:
-
Semihosting: built-in to every ARM chips, need adding additional library and running in debug mode.
-
Console log: forward to a native UART port, a Virtual COM port through a USB port.
-
Serial Wire View (SWV): fast output over dedicated Single Wire Output (SWO) pin, but it’s only available on Cortex-M3+, and this is uni-direction communication.
-
Real Time Transfer (RTT): extremely fast but only work with SEGGER Debugger, can have a real-time bi-direction communication.
Serial Wire Viewer#
Cortex-M based microcontrollers integrate some debugging and tracing technologies, including JTAG and SWD. Tracing allows exporting in real-time internal activities performed by the CPU. The Instrumentation Trace MacroCell (ITM) allows sending software-generated debug messages through a specific signal I/O named Serial Wire Output (SWO).
The ITM support is available in Cortex-M3/M4/M7 microcontrollers.
The protocol used on the SWO pin to exchange data with the debugger probe is called Serial Wire Viewer (SWV).
Compared to other “debugging-alike” peripherals like UART/VCOM redirection or the ARM Semihosting, Serial Wire Viewer is really fast. Its communication speed is proportional to the MCU speed. To properly decode the bytes sent over the SWO port, the host debugger needs to know the frequencies of the CPU and SWO port.
SWV protocol defines 32 different stimulus ports: a port is a “tag” on the SWV message used to enable/disable messages selectively. These channels allow for separating the diagnostic data into different categories. For instance, ARM recommends channel 0 for text data (e.g., from printf) and channel 31 for RTOS events, while the other channels can be used for any other purposes.
SWV-Supported Debugger
Any original ST’s board has an integrated ST-LINK/V2 debugger which supports SWO to trace ITM outputs on Cortex-M3+. That debugger can be used to program and debug an external MCU on other board, or turn into an J-Link debugger.
Many ST-LINK clones do not have SWO pin exposed. When open the clone board, the STM32F103 chip is found, which is the same as the chip used in the original ST-LINK. So, the problem of missing SWO can be solved by exporting the SWO pin.
ITM Functions#
The ITM stimulus registers are standardized by ARM and found on address 0xE0000000 (port 0) through 0xE000007C (port 31). To write data, enable ITM tracing and write data to the corresponding register.
The CMSIS-Core package for Cortex-M3/M4/M7 cores provides necessary glue to handle SWV protocol. For example, the ITM_SendChar() routines allows to send a character using the SWO pin.
__STATIC_INLINE int32_t ITM_ReceiveChar (void) {
  int32_t ch = -1; /* no character available */
  if (ITM_RxBuffer != ITM_RXBUFFER_EMPTY) {
    ch = ITM_RxBuffer;
    ITM_RxBuffer = ITM_RXBUFFER_EMPTY; /* ready for next character */
  }
  return (ch);
}

__STATIC_INLINE uint32_t ITM_SendChar (uint32_t ch) {
  if (((ITM->TCR & ITM_TCR_ITMENA_Msk) != 0UL) && /* ITM enabled */
      ((ITM->TER & 1UL ) != 0UL)) { /* ITM Port #0 enabled */
    while (ITM->PORT[0U].u32 == 0UL) { __NOP(); }
    ITM->PORT[0U].u8 = (uint8_t)ch;
  }
  return (ch);
}
Setup project#
Start a new project with STM32F411RE through CubeMX or just an empty project.
- Take note of the System Clock Frequency, such as 100 MHz, as we need to use it later
- Debug mode is set to Trace Asynchronous SW at reset, no need to configure this interface
Pin map
| STM32F411RE | Description |
|---|---|
| PA13 | SWDIO |
| PA14 | SWCLK |
| PB3 | SWO |
Override system calls#
Standard C libraries
GNU ARM libraries use newlib to provide standard implementation of C libraries. To reduce the code size and make it independent to hardware, there is a lightweight version newlib-nano used in MCUs.
However, newlib-nano does not provide an implementation of low-level system calls which are used by C standard libraries, such as print() or scan(). To make the application compilable, a new library named nosys should be added. This library just provide a simple implementation of low-level system calls which mostly return a by-pass value.
The lib newlib-nano is enabled via linker options --specs=nano.specs, and nosys is enabled via linker option --specs=nosys.specs. These two libraries are included by default in GCC linker options in generated project, check it here.
Default system call
There is a file syscalls.c containing implementation for standard input/output calls of the system, such as _write() function is used by printf(). That implementation is marked as weak, so we can override them.
__attribute__((weak)) int _write(int file, char *ptr, int len) {
  int DataIdx;
  for (DataIdx = 0; DataIdx < len; DataIdx++) {
    __io_putchar(*ptr++);
  }
  return len;
}
Redirect to ITM
To redirect the output to the ITM, override the _write() function in main.c and replace the call to __io_putchar by ITM_SendChar:
#include <stm32f4xx.h>

int _write(int file, char *ptr, int len) {
  int DataIdx;
  for (DataIdx = 0; DataIdx < len; DataIdx++) {
    ITM_SendChar(*ptr++);
  }
  return len;
}
Print a counter variable
Create a variable char counter = 0; and in the main while loop, increase it by 1 and print out its value using standard function printf() every second.
char counter = 0;
int delay;

int main(void) {
    while (1) {
        printf("counter = %d\n", counter++);
        delay = 160000;
        while(delay){ delay--; }
    }
}
SWV Windows#
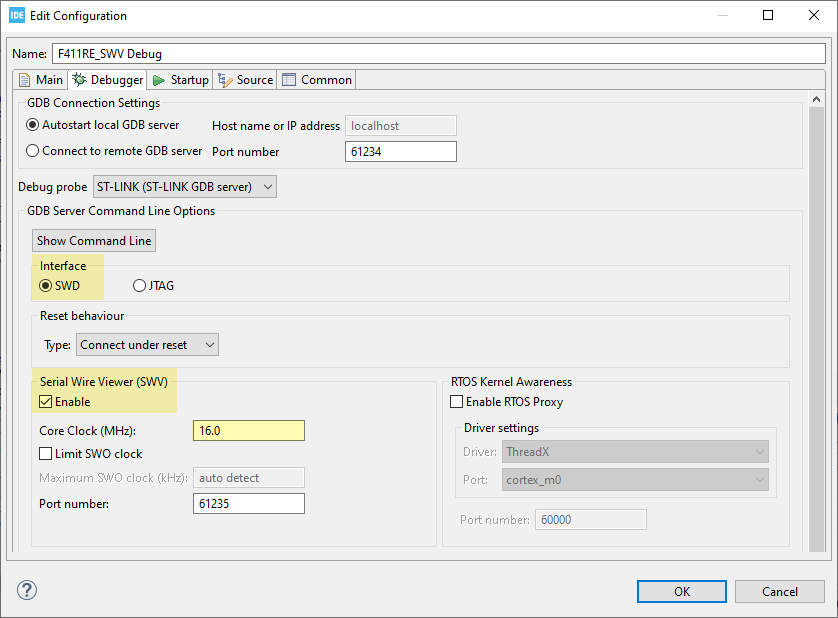
Debugger Configuration:
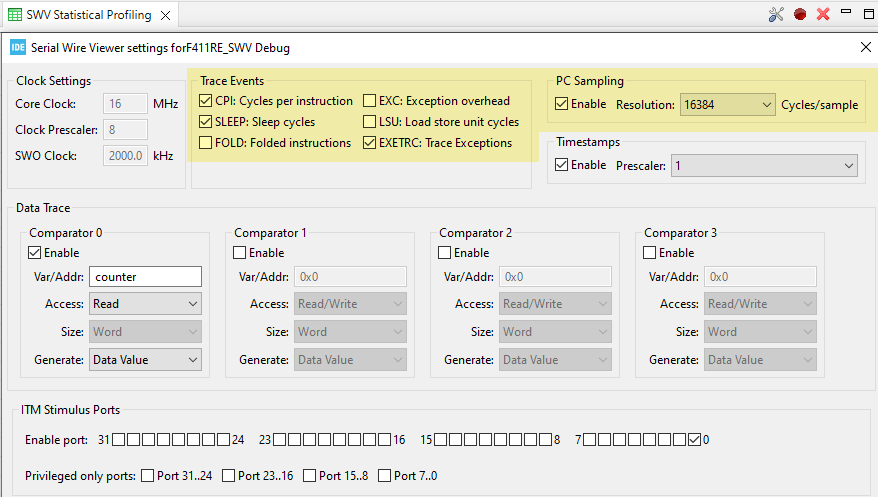
To enable the SWV function, in the Debugger Configuration screen, select below settings:
- Interface:
SWD - Serial Wire Viewer:
- Enable:
true - Core Clock: should match the real CPU clock in the setup step, such as 100 MHz
- Enable:
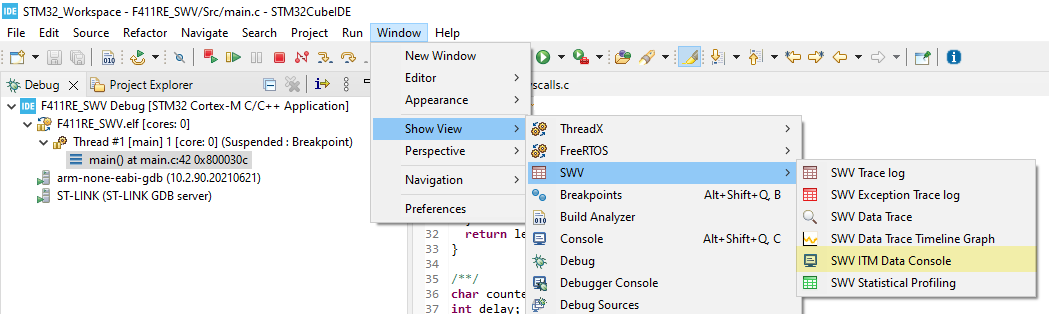
SWV Windows:
The next step is to add SWV Windows into the Debug perspective of IDE.
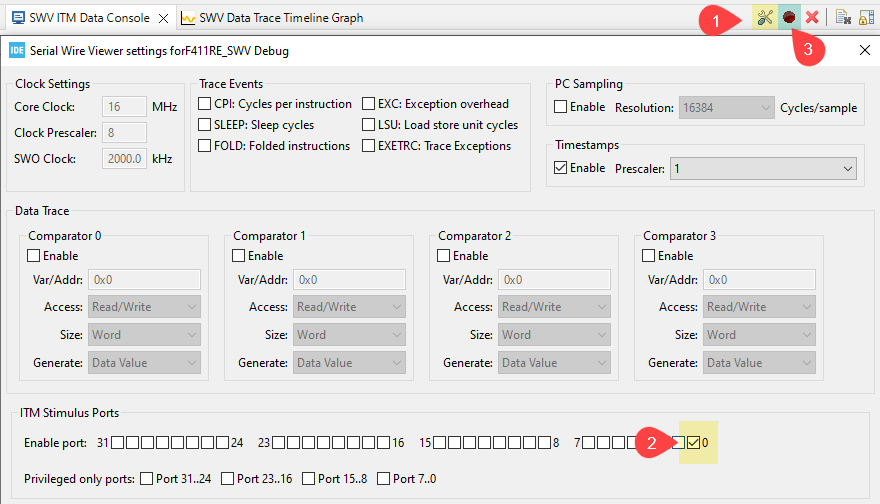
Select Windows → Show View → SWV and select one of available windows type. For displaying ITM Print data, select the SWV ITM Data Console window.
Click on the Config icon in the SWV ITM Data Console tab, enable the ITM 0 and apply. Press on the Red button to start reading the SWV data.
Resume the execution and observe the text appears on the ITM Data console:
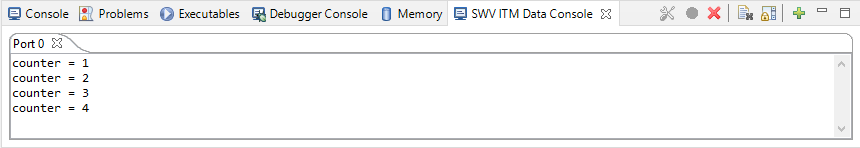
counter is printed in the ITM Data Console
Inspect variables#
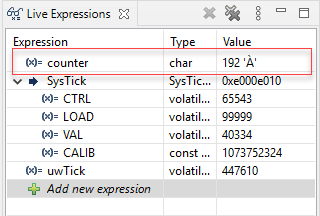
The Debug IDE can inspect a variable in real-time using the Live Expression feature. For example, add uwTick to see the instant system time in milliseconds, add counter to show the instant value.
SWV also has a useful graph mode to monitor variables. Open the SWV Data Trace Timeline Graph and open its configuration to enable Comparator 0 to trace the counter variable.
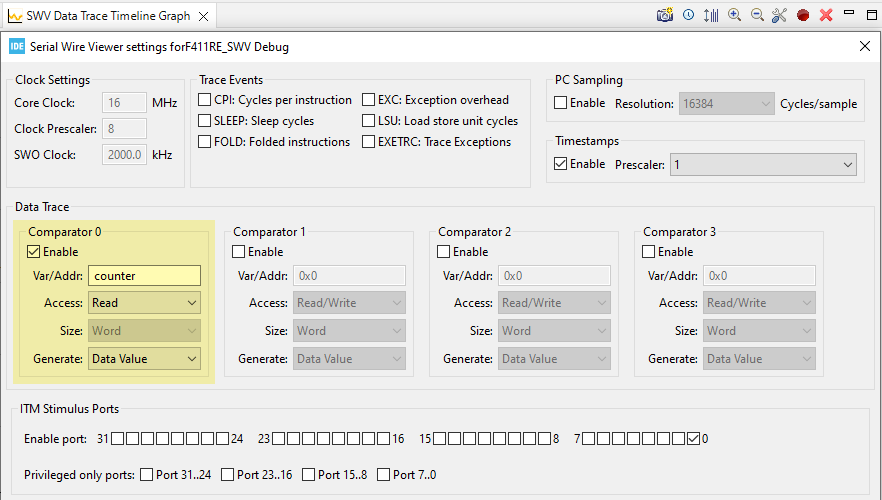
Press on the red button to start reading the SWV data. Resume the execution and observe the data being drawn on the graph:
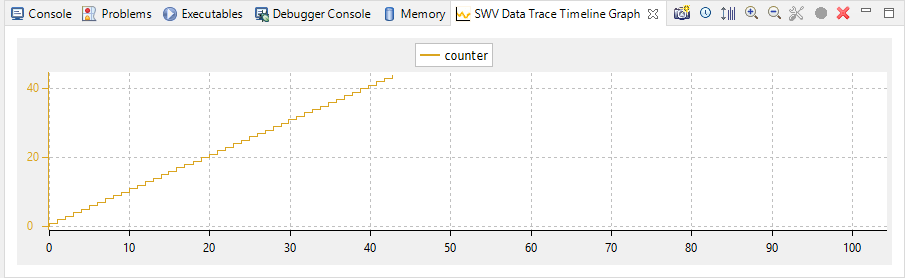
counter is drawn on the graph
Trace events#
SWV can be used to trace different types of events as it can sample Program Counter (PC) register and access some special registers to calculate some statistics.
Events#
- CPI — Cycles per instruction
- For each cycle beyond the first one that an instruction uses, an internal counter is increased with one. The counter (DWT CPI count) can count up to 256 and is then set to 0. Each time that happens, one of these packets are sent. This is one aspect of the processors performance and used to calculate instructions per seconds. The lower the value, the better the performance.
- SLEEP — Sleep cycles
- The number of cycles the CPU is in sleep mode. Counted in DWT Sleep count register. Each time the CPU has been in sleep mode for 256 cycles, one of these packets is sent. This is used when debugging for power consumption or waiting for external devices.
- FOLD — Folded instructions
-
A counter for how many instructions are folded (removed). Every 256 instruction folded (taken zero cycles) will receive one of these events. Counted in DWT Fold count register.
Branch folding is a technique where, on the prediction of most branches, the branch instruction is completely removed from the instruction stream presented to the execution pipeline. Branch folding can significantly improve the performance of branches, taking the CPI for branches below 1.
- EXC — Exception overhead
- The DWT Exception count register keeps track of the number of CPU cycles spent in exception overhead. This includes stack operations and returns but not the time spent processing the exception code. When the timer overflows, one of these events is sent. Used to calculate the actual exception handling cost to the program.
- LSU — Load Store Unit Cycles
- The DWT LSU count register counts the total number of cycles the processor is processing an LSU operation beyond the first cycle. When the timer overflows, one of these events is sent. With this measurement, it is possible to track the amount of time spent in memory operations.
- EXETRC — Trace Exceptions
- Whenever an exception occurs, exception entry, exception exit and exception return events are sent. These events can be monitored in the SWV Exception Trace Log view. From this view, it is possible to jump to the exception handler code for that exception.
- PC Sampling
- Enabling this starts sampling the Program Counter at some cycle interval. Since the SWO pin has a limited bandwidth, it is not advised to sample to fast. Experiment with the Resolution (cycles/ sample setting) to be able to sample often enough. The results from the sampling are used, among other things, for the SWV Statistical Profiling view.
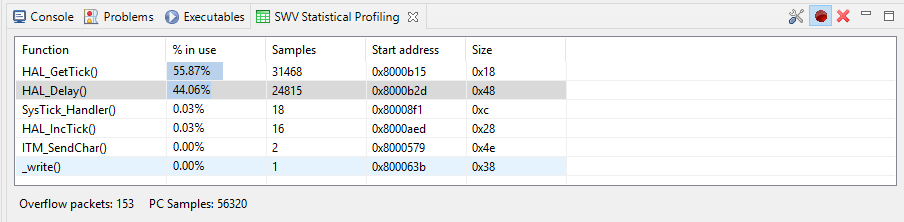
Statistical Profiling#
When enable PC Sampling, the IDE can show the amount of execution time spent within various functions. This is useful when optimizing code.
When pause the execution, the SWV Statistical Profiling view will display a table with calculated information. Clear the collected data to start a new profiling session.
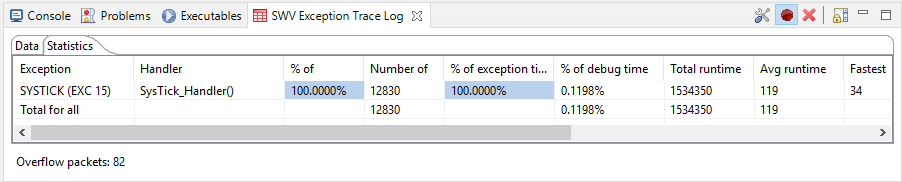
Exception Trace#
Every event sent when CPU handles an exception will be recorded and these data is used to calculate some information about exceptions. There are two tabs, but the useful information is in the statistic tab.
Receive data using scanf
In above section, the _write function is overridden to redirect printf to ITM0. The same method can be applied to override _read function to receive data for the function scanf.
int _read(int file, char *ptr, int len) {
    for (int DataIdx = 0; DataIdx < len; DataIdx++) {
        *ptr++ = ITM_ReceiveChar();
    }
    return len;
}
However, when compile this code, an error will be raised due to undefined reference to the ITM_RxBuffer. This special variable is left to be defined by Debugger which support SWV input functions, such as Keil ARM. STM32CubeIDE does not support.
There are ideas to use either Semihosting or SWD to write data into the ITM_RxBuffer as mentioned in here. SEGGER RTT is well done of utilizing the ARM Debug Access Port (DAP) and background memory access to provide bi-direction communication.
Use SWV with other software
-
STM32Cube Programmer
Open the SWV tab to see the Viewer. This software also have color syntax to helps displaying log with debug/ warning/ error messages.
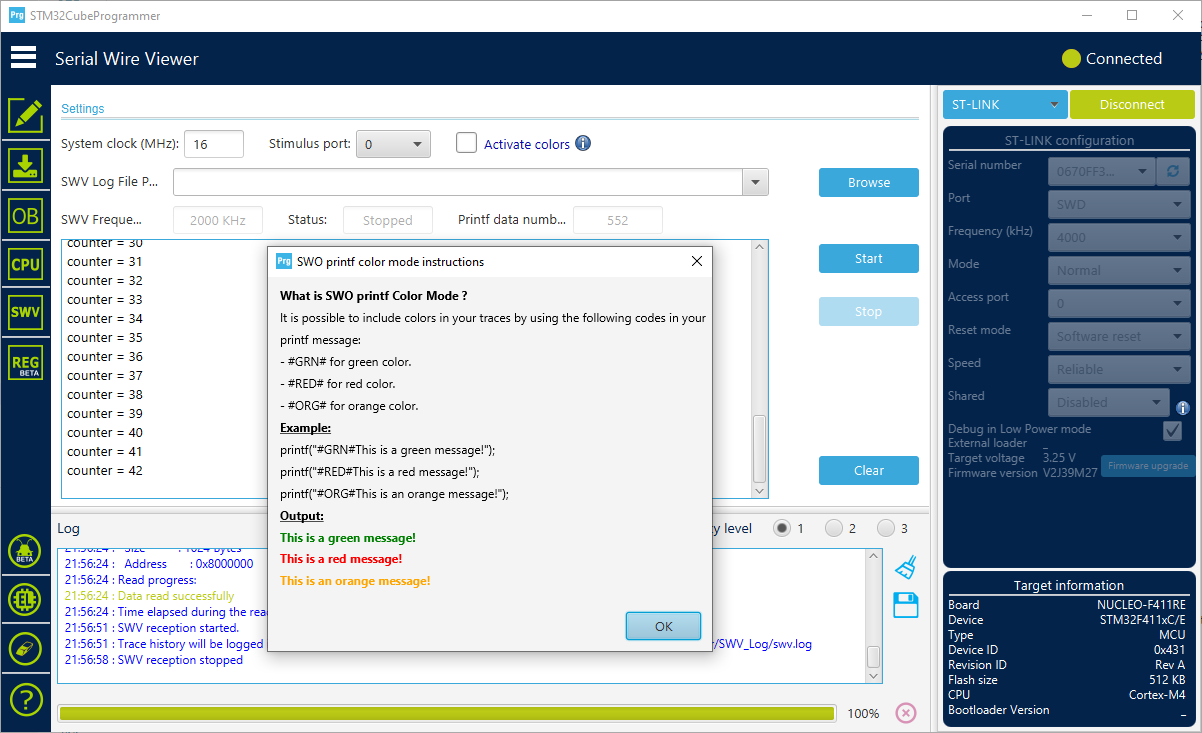
Show SWV log in STM32Cube Programmer -
Segger J-Link SWO Viewer
If you use J-Link debugger, you can see SWO log with this tool also.
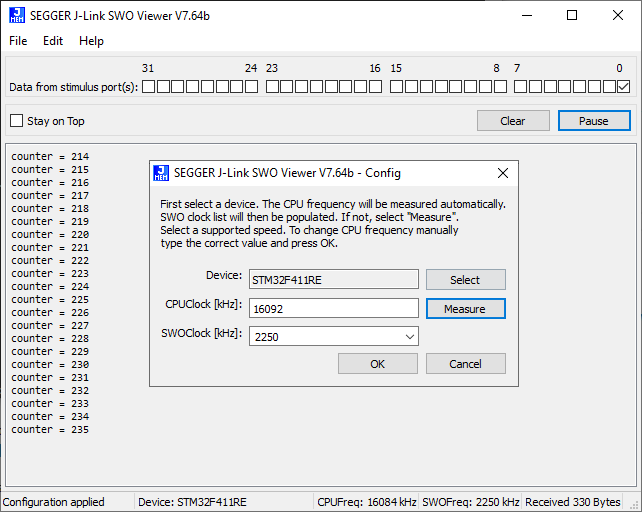
J-Link SWO Viewer
Export SWO pin#
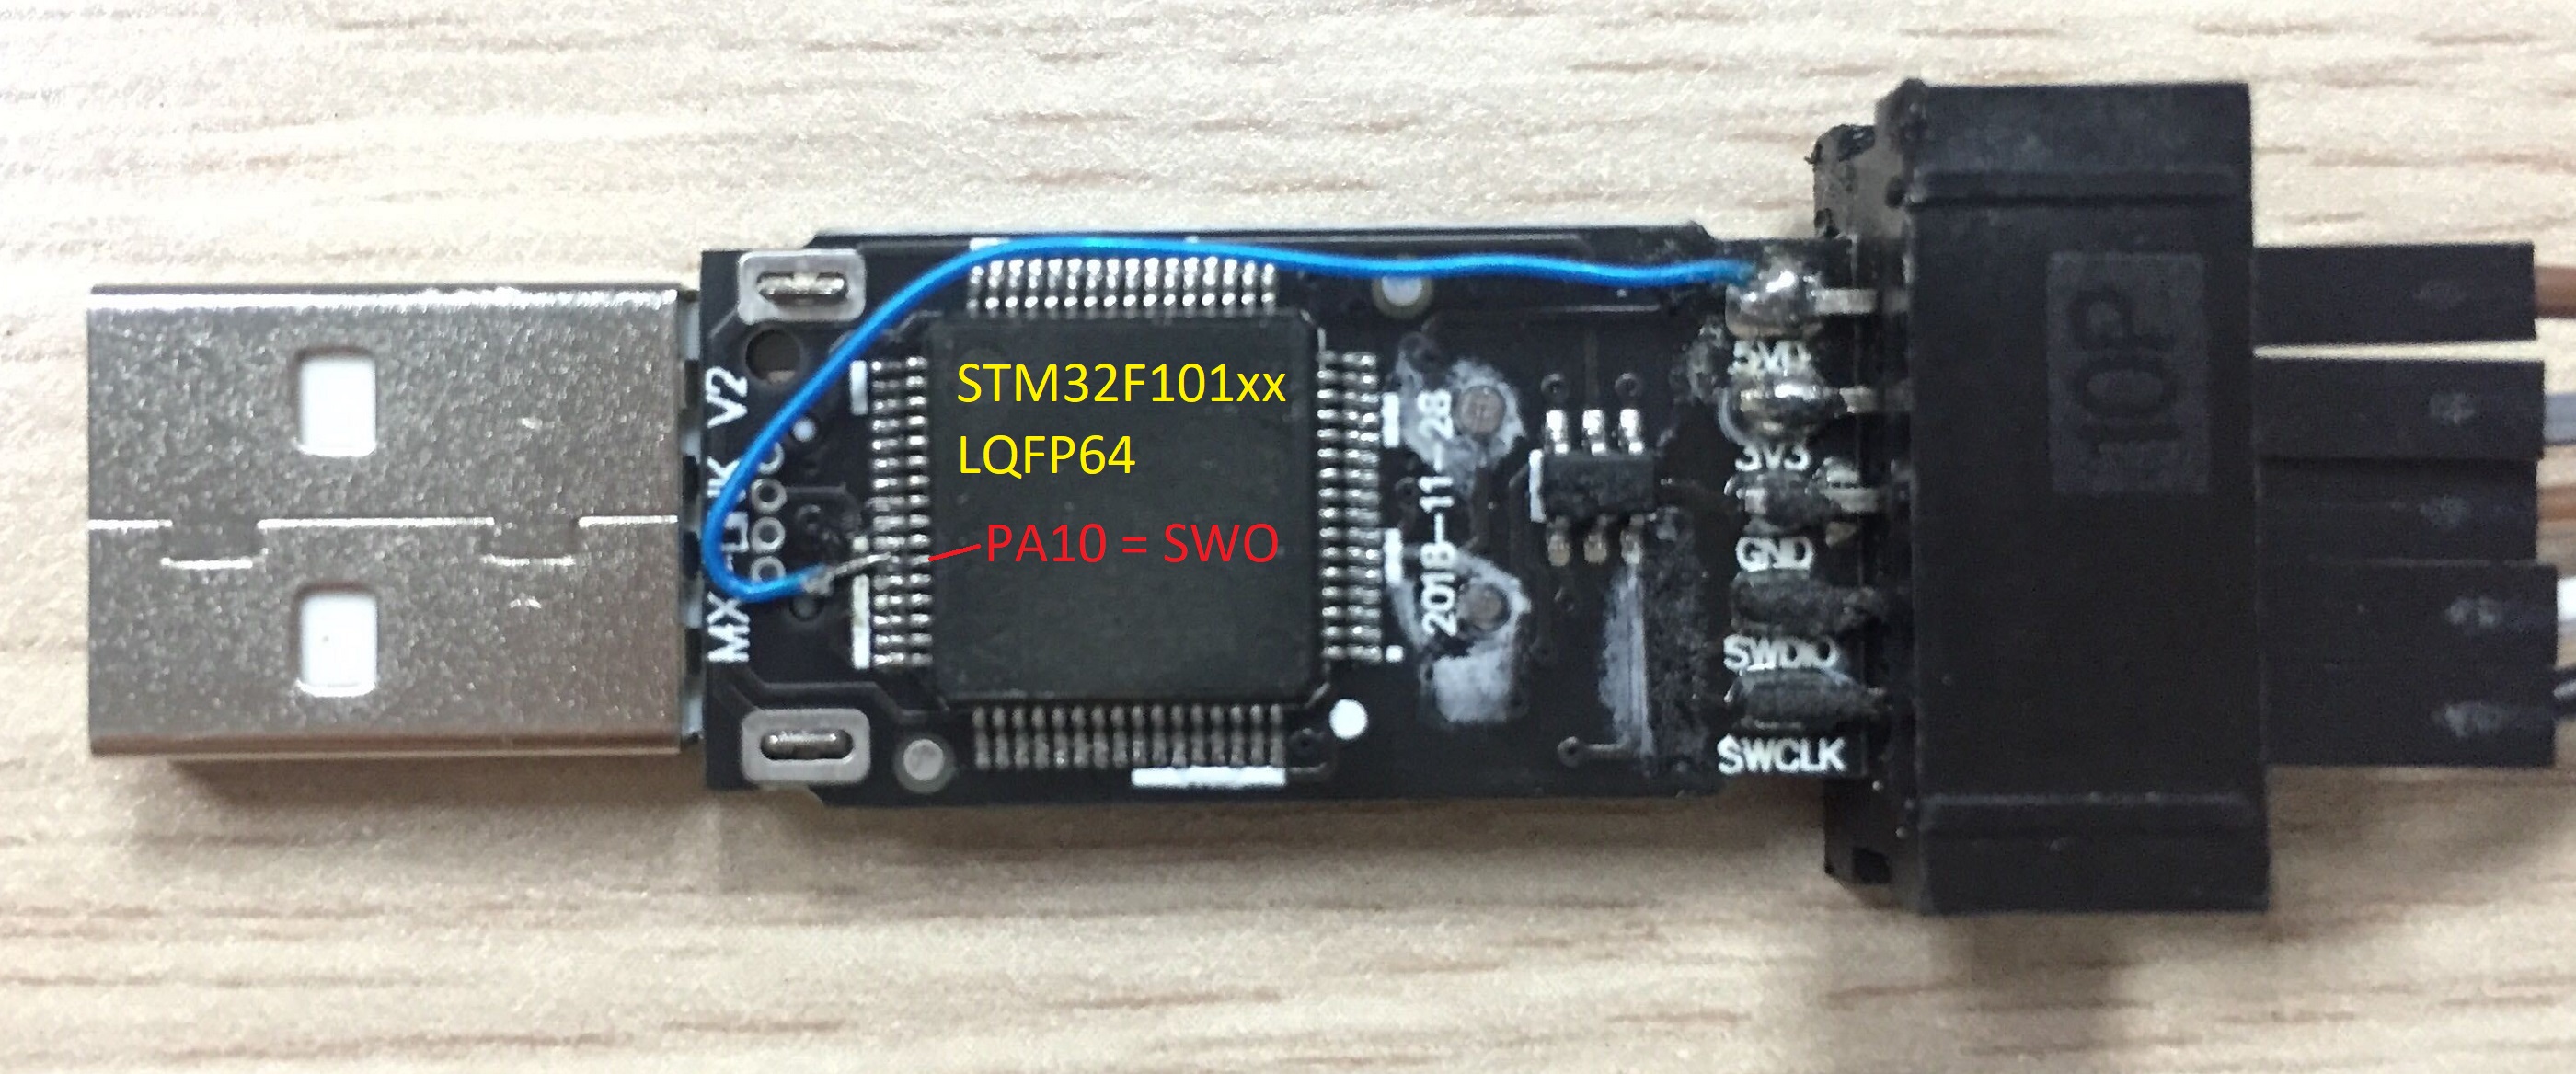
Many ST-LINK clones do not have SWO pin exposed. When open the clone board, the STM32F103 chip is found, which is the same as the chip used in the original ST-LINK. So, the problem of missing SWO can be solved by exporting the SWO pin.
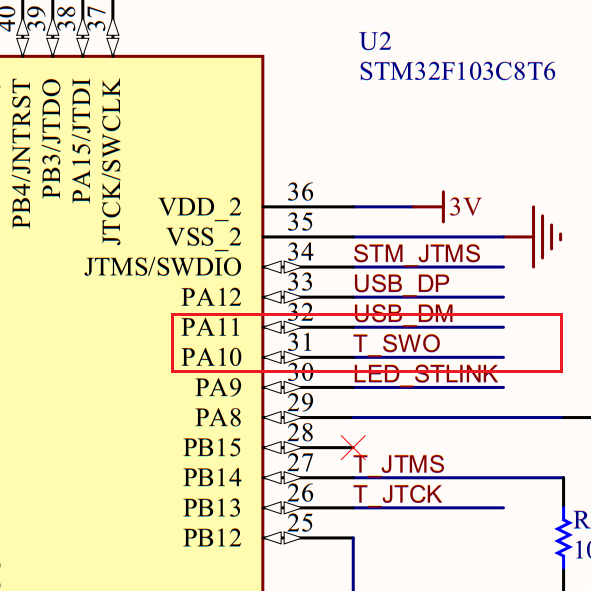
ST-LINK/V2 Schematic#
The original boards from ST always come with a schematic. Under the tab CAD Resources of the page for the Nucleo-F103 board on ST’s site, the schematic is nucleo_64pins_sch.zip.
In the schematic, it is clear that T_SWO line is connected to the pin PA10 (#31) on the STM32F103 chip.
Clone schematic#
There is no way to see a schematic of a clone device. Clone hardware modules are marked with MX-LINK label. However, as the schematic for ST-LINK/V2 is public in the board document, it’s expected that the clone uses the exactly same hardware with the original one. The firmware download works well on the clone, so it’s supposed that the hardware is identical, at least in the I/O exporting.
People also have found that some cloned devices use STM32F101 instead of STM32F103, and the pinout maybe LQFP64, not LQFP48. However, thanks to the pin compatibility of STM32, PA10 will still have the same function on variant chips.
Wire SWO Pin#
One thing apparently clear at the moment is the PA10 (#31) pin can be exposed to the header. Just cut a 5 V pin, and wire the PA10 pin to it. It is better to make it go through a small resister (22 R or 100 R).